LUPIN Limited
Headquartered in Mumbai, Lupin is an innovation led transnational pharmaceutical company producing and developing a wide range of branded & generic formulations, biotechnology products and APIs globally. The company is a significant player in Cardiovascular, Diabetology, Asthama, Pediatric, CNS, GI, Anti-Infective and NSAID space and holds global leadership positions in the Anti-TB and Cephalosporin segment.
|
BSE |
500257 |
|
NSE |
LUPIN |
|
REUTERS |
LUPN.BO |
|
INCEPTION |
1983 |
|
IPO |
1993 |
|
INDUSTRY |
Pharmaceuticals – Bulk Drugs |
|
CMP (as on 3/6/2016) |
1450 |
|
Stock Beta |
0.7228 |
|
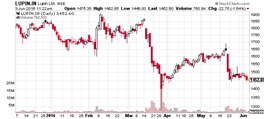
52 Week H/L |
1280.00 / 2129.00 |
|
Market Cap (Cr) |
6561.60 |
|
Equity Capital (cr) |
90.14 |
|
Face Value (Rs) |
2 |
|
Average Volume |
7,55,423 |
|
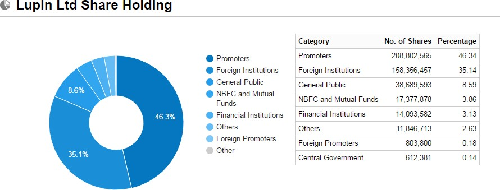
Shareholding Pattern (%) |
|
|
Promoters |
46.52 |
|
Non Institutions |
53.48 |
|
Grand Total |
100.00 |
LUPIN Limited- Potential Catalysts
-
Growth in US and sales of generic drug to drive revenue with 20% CAGR for FY16-FY18
-
Old ANDAs approval momentum to sustain in the near-term
-
Gavis acquisition: A step to expand capacity and pipeline size
-
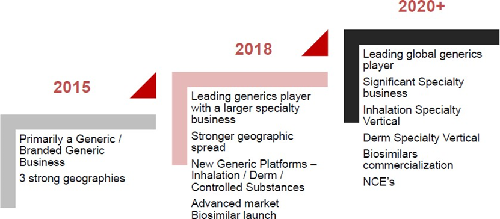
Move from Generics to Specialty improve margins
LUPIN Limited- Recommendation
With Superior project management skills, focus on measuring and monitoring quality and its planned expansion LUPIN Technologies will be able to grow with revenue CAGR 20% and Margins improving 200-300 bps. We recommend BUY on the stock at CMP of Rs. 1450 to target of Rs. 1720 (EPS of 59.34x FY17).
LUPIN Limited- Financial Summary
|
Yearly Income Statement |
2012 |
2013 |
2014 |
2015 |
2016 E |
2017 E |
2018 E |
|
Total Income |
6974.05 |
9489.48 |
11203.12 |
12839.46 |
13889.26 |
16436.35 |
19285.50 |
|
EBIDTA |
1335.85 |
2118.07 |
2919.34 |
3689.04 |
3434.24 |
4583.81 |
5484.76 |
|
EBIT |
1108.33 |
1785.88 |
2658.37 |
3254.34 |
2970.74 |
4041.41 |
4886.91 |
|
PAT |
867.65 |
1314.16 |
1836.37 |
2403.24 |
2270.69 |
2673.57 |
3282.24 |
|
EPS (UnitCurr.) |
19.43 |
29.39 |
40.99 |
53.54 |
50.45 |
59.34 |
72.84 |
|
EBIDTA Margin |
19.19% |
22.39% |
26.33% |
29.28% |
25.06% |
28.23% |
28.81% |
|
EBIT Margin |
15.92% |
18.87% |
23.98% |
25.83% |
21.68% |
24.89% |
25.67% |
|
PAT Margin |
12.44% |
13.85% |
16.39% |
18.72% |
16.35% |
16.27% |
17.02% |
BUSINESS DISCRIPTION
Lupin Ltd., incorporated in the year 1983, is a Large Cap company (having a market cap of Rs 66516.09 Cr.) operating in Pharmaceuticals and health care sector.
Lupin Limited is an India-based transnational pharmaceutical company. The Company is engaged in the producing, developing and marketing of branded and generic formulations, and active pharmaceutical ingredients (APIs). The Company's brands include Gluconorm, Tonact, Rablet, Budamate, Telekast, Rcinex, Clopitab, Telista, Ramistar and Akt. The Company manufactures products in the therapy areas, such as anti-TB, cardiovascular, anti-asthma, diabetology, central nervous system, gynecology, gastro-intestinal (GI), anti-infective and others. The Company's subsidiaries include Lupin Pharmaceuticals Inc., Kyowa Pharmaceutical Industry Co., Ltd., Pharma Dynamics (Proprietary) Ltd., Hormosan Pharma GmbH, Multicare Pharmaceuticals Philippines, Inc., Generic Health Pty Ltd., Kyowa CritiCare Co., Ltd., Lupin Holdings B.V., Lupin Atlantis Holdings SA and Lupin Pharma Canada Ltd., among others.
Lupin Limited is 6th largest and fasting growing top 10 generics player in the US (5.5% market share by prescriptions, IMS Health) and 3rd largest Indian pharmaceutical company by sales globally. The company is also the fastest growing top 10 generic pharmaceutical player in Japan (ranked 8th) and South Africa (ranked 4th).
Lupin Ltd. key Products/Revenue Segments include
-
Tablets which contributed Rs 4819.16 Cr to Sales Value (48.94% of Total Sales)
-
Capsules which contributed Rs 1758.64 Cr to Sales Value (17.86% of Total Sales)
-
Bulk Drugs (Intermediates) which contributed Rs 1156.69 Cr to Sales Value (11.74% of Total Sales)
-
Liquids (Formulations) which contributed Rs 747.77 Cr to Sales Value (7.59% of Total Sales)
-
Injectible Vials which contributed Rs 529.93 Cr to Sales Value (5.38% of Total Sales)
-
Other Services which contributed Rs 376.61 Cr to Sales Value (3.82% of Total Sales)
-
Others which contributed Rs 154.18 Cr to Sales Value (1.56% of Total Sales)
-
Export Incentives which contributed Rs 127.27 Cr to Sales Value (1.29% of Total Sales)
-
Creams & Powders which contributed Rs 67.47 Cr to Sales Value (0.68% of Total Sales)
-
Inhalers which contributed Rs 62.47 Cr to Sales Value (0.63% of Total Sales)
-
Liquids (Injectables) which contributed Rs 32.13 Cr to Sales Value (0.32% of Total Sales)
-
Other Operating Revenue which contributed Rs 13.66 Cr to Sales Value (0.13% of Total Sales)
for the year ending 31-Mar-2015.
MANAGEMENT & GOVERNANCE
Shareholding pattern as on March 31st, 2016
|
Name |
Since |
Current Position |
|
|
Executive Chairman of the Board |
|
|
2013 |
Chief Executive Officer, Director |
|
|
2013 |
Executive Vice Chairman of the Board |
|
|
2015 |
Chief Financial Officer, Director |
|
|
2013 |
President - Europe and Head of Inhalation Strategy |
|
|
2013 |
President – Global Sourcing |
|
|
2010 |
President - Technical Operations |
|
|
|
President - API & Global TB |
|
|
|
President - Novel Drug Discovery & Development |
|
|
2010 |
President - Biotechnology |
|
|
2013 |
President - Finance |
Company has Deloitte Haskins & Sells as its auditors. As of 31-Mar-2016, the company has a total of 450,582,969 shares outstanding.
INVESTMENT RATIONALE
Growth in US and sales of generic drug to drive revenue with 20% CAGR for FY16-FY18
US growth despondency due to pricing has given way to a sharp sequential growth in US business. While at least USD6-7mn of the growth was due to Suprax seasonality, given that Lupin Ltd has launched only 4 products over past few months, the growth is all the more surprising. Lupin Limited has told that growth was due to mix of volumes and pricing means improved realization beyond gFortamet, which is a change from severe pricing pressure witnessed in past few quarters.
Revenue distribution geographically
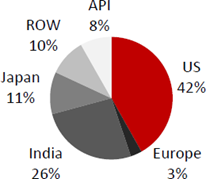
Generics business grew by 18% QoQ as higher cephalosporin sales and a partial impact of gFortamet price hikes negated the effect of market share loss in gTricor and niacin. The branded business was up 56% QoQ to US$ 15mn, driving a ~22% QoQ growth in the US business. Robust Q4 numbers point to even stronger Q1FY17 earnings, boosted not only by gGlumetza but also the full impact of hike in gFortamet prices and Suprax seasonality.
FDA inspected nine out of LPC’s 12 plants in the last few months, of which Goa received form 483 with nine observations, and Indore and Aurangabad plants three observations each. Indore observations are cleared while those for Aurangabad are expected to be cleared soon. As per management, it has addressed form 483 issues and the Establishment Inspection Report (EIR) is awaited. Note that approvals are not withheld from these plants.
Also in constant currency terms, we expect the Japanese market to deliver 10-12% growth. Though volume growth is expected to remain strong, driven by increasing generic penetration and patent expiries, the pricing environment remains challenging due to aggressive competition from local generic companies. The increase in patent expiry, particularly in Neuro/CNS and cardiovascular segments over the next two years, should benefit Lupin, as the company has a strong presence in these segments.
Overall though the price hikes and steady stream of launches alleviate near-term earnings uncertainty, triggers for FY17 and beyond are still uncertain. See the stock supported by improved near term visibility.
Old ANDAs approval momentum to sustain in the near-term
So far Lupin Limited has received approvals for 106 ANDAs. The company has not received approvals for an ANDA filed after FY13. Only two ANDAs filed in FY13 have received approvals. Most of the approvals received in FY16 were filed in FY11 and FY12. Approvals that are coming through now are more than three-year-old filings. Based on the approval history and number of ANDA filings each year, we believe that out of the 106 ANDAs pending approval as of 1QFY16 (including tentative approval), approximately 25% or 26 ANDAs were filed before FY11.
Pending ANDA approvals

The average time for approval has been rising for Lupin Ltd, as is the case with the rest of the industry. The average time for approval for ANDAs approved in FY16 is 66 months compared with 51 months for approvals in FY15. With approximately 36 ANDAs which are more than 50 months old, momentum for new approvals is likely to remain high in the near term.
Out of the 106 ANDAs pending approval as of July 2015, we believe 61 ANDAs are in the public domain. This is based on litigation records and voluntary disclosure by Lupin Limited. The 61 ANDAs have annual brand sales of USD 40bn, according to our estimates. Thus, we believe that 46 ANDAs with sales of USD15bn are not in the public domain. Therefore, the pipeline visibility is high at 57% in terms of the number of ANDAs and 73% in terms of the brand value of the pending pipeline.
Gavis acquisition: A step to expand capacity and pipeline size
Lupin Ltd announced its acquisitions of Gavis Pharmaceuticals and Novel Laboratories for a total of USD880mn in 2015. These acquisitions should help add products in the dermatology and controlled substance segments. They will also help add 19 controlled substances and 22 dermatology products to the pipeline. Even the products under development have larger proportions of derma and controlled substances.
-
Through the acquisitions we believe Lupin will achieve the following objectives:
-
Larger number of shots at goal: Lupin Limited gets a pipeline of 66 products pending approval with brand sales of USD9bn.
-
Expedite the development programmes in derma and controlled substance.
-
Expand R&D capacity: Lupin Ltd expects the expanded R&D capability will help to enhance its ANDA filing capacity from 25-30 per annum to ~40-50.
Since Lupin has already made initial investments in segments like derma and controlled substance, an area where Gavis has a strong presence, the acquisition makes a limited impact in improving formulation capabilities, in our view.
Like for Lupin, we find the approval rate for Gavis has also increased in the recent past. Interestingly, we find that the average time for approval for Gavis is an impressive 37 months in 2015 so far. We estimate that ~40 out of the 66 ANDAs pending approval were filed before 2013 and hence are ready for approval in the near term. This, along with the fact that Gavis’ facility faces no regulatory uncertainty (the facility was inspected in 2015 without any 483 observations) implies a high intensity of product approvals. LPC&rsquo's management expects Gavis to gain 23 more approvals in FY16 (in the next six-seven months) and 34 more in FY17.
Move from Generics to Specialty improve margins
Lupin Limited is committed to developing a branded pharmaceutical presence for pediatric practice in the US market. It has launched Suprax® an important anti-infective product in pediatric and other physician practices within the United States. Suprax® is now available in tablets and suspension formulations. Lupin Ltd has an exclusive license in the United States to use the Suprax® trademark. They have plans to pediatric products and help meet the needs of children. Our focus is on in-house product development with our proprietary oral controlled release and taste masking platforms.
We expect a step-up in R&D spending by recording a CAGR of 25% over FY15-18F. R&D as a percentage of sales should be at 11-12% over the next three years. Despite the rise in R&D spending, we estimate EBITDA margins to range between 27% and 32%. We believe acquisitions will lead to a rise in net debt in FY16F.
Specialty drugs will have a high margin compared to generic drugs due to high demand and less supply. Lupin has been spending enough R&D on changing the face from Generics to Specialty. However, cash flows on account of US launches should help bring down net debt over FY17F-18F.
VALUATION
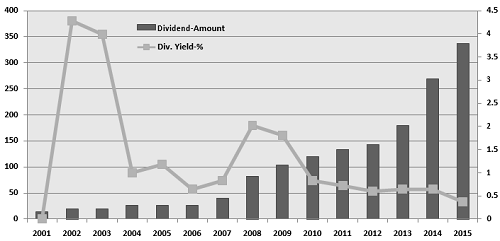
LUPIN Limited is currently trading at 1450 per share with a market capitalization of 6533.53 Crores. It has negligible debt with long term Debt to Equity of 0.01. It has total cash and bank balance of 797.5 Cr. Its payout increased to 37% (FY15) from 28% last year (FY14).
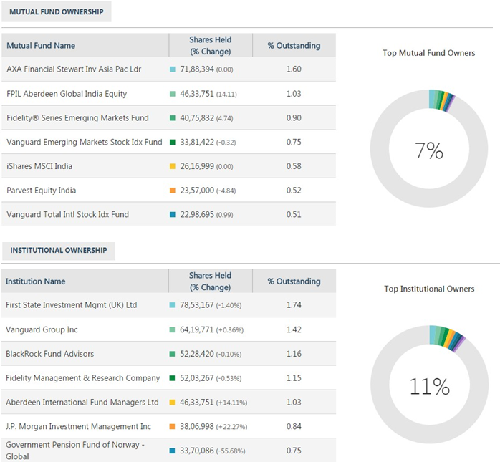
Consistent dividend will help institutions who hold huge large stake get incentive and is treated as boost to investors.
We value LUPIN Ltd for a price target of 1720 for FY17 with expected revenue CAGR 20% for FY16-FY19. For valuation we assume that over the period company will keep capital structure unaltered and tax rate unchanged.
|
Co_Name |
Market Cap |
Market Price |
Reserve |
EPS |
Book Value |
P/E Ratio |
P/BV |
Div Yield % |
Long Term D/E |
|
Sun Pharma.Inds. |
192022.86 |
797.85 |
25378.61 |
18.29 |
106.45 |
43.62 |
7.5 |
0.38 |
0.03 |
|
Lupin |
72285.01 |
1450.85 |
8784.16 |
44.61 |
196.9 |
28.55 |
8.15 |
0.47 |
0.02 |
|
Dr Reddy's Labs |
51223.24 |
3002.4 |
12748.3 |
143.34 |
577.54 |
20.95 |
5.2 |
0.67 |
0.2 |
|
Aurobindo Pharma |
46099.66 |
787.8 |
5097.51 |
31.15 |
88.11 |
25.29 |
8.96 |
0.28 |
0.3 |
|
Cipla |
41924.36 |
521.8 |
10619.68 |
20.07 |
134.17 |
26 |
3.9 |
0.38 |
0.03 |
|
Cadila Health. |
32933.8 |
321.7 |
5249.5 |
14.51 |
41.53 |
22.17 |
7.76 |
0.99 |
0.33 |
|
Divi's Lab. |
28066.67 |
1057.25 |
3442.27 |
30.25 |
131.67 |
34.95 |
8.02 |
0.95 |
0 |
|
Glenmark Pharma. |
24659.91 |
873.95 |
4637.03 |
26.45 |
139.83 |
33.04 |
6.24 |
0.23 |
1.06 |
|
Torrent Pharma. |
23673.03 |
1398.95 |
2405.94 |
93.89 |
147.18 |
14.9 |
9.49 |
0.8 |
0.67 |
|
Wockhardt |
10337.56 |
935.45 |
3518.61 |
28.67 |
309.21 |
32.63 |
3.03 |
0 |
0.31 |
|
Natco Pharma |
7865.71 |
451.6 |
1152.1 |
8.58 |
68.15 |
52.63 |
6.64 |
0.21 |
0.18 |
|
|
|||||||||
|
Average |
48281.07 |
1068.42 |
7548.52 |
41.80 |
176.43 |
31.10 |
6.81 |
0.49 |
0.28 |
Lupin is trading at discount to its peers, P/E at 28.55 against 31.10 its peers. At 31.10 P/E Lupin should be trading at its fair market value of 1570 per share. Though this value is on the higher side, with the quality of Lupin’s management, its lower debt and higher growth it should be trading near to its fair value. We believe that Lupin should trade at premium given Lupin’s lower debt, strong brand equity, healthy growth prospects, improving profitability margins, better return ratios, strong balance sheet and prudent management.
|
Co_Name |
Market Price |
Market Capitalisation |
EPS (cons.) |
Bookvalue (cons.) |
P/E Ratio |
P/E Ratio - cons |
P/BV |
P/BV - cons |
Dividend Yield % - cons |
|
Sun Pharma.Inds. |
812.10 |
195452.48 |
18.29 |
106.45 |
48.61 |
44.40 |
8.96 |
7.63 |
0.37 |
|
Lupin |
1450.00 |
6533.53 |
44.61 |
196.90 |
22.93 |
32.90 |
5.71 |
7.45 |
0.51 |
|
Dr Reddy's Labs |
3170.25 |
54086.89 |
143.34 |
577.54 |
32.59 |
22.12 |
4.66 |
5.49 |
0.63 |
|
Aurobindo Pharma |
750.00 |
44148.12 |
31.15 |
88.11 |
28.50 |
24.22 |
7.32 |
8.56 |
0.30 |
|
Cipla |
473.55 |
38047.69 |
20.07 |
134.17 |
27.22 |
23.59 |
3.09 |
3.53 |
0.42 |
|
Cadila Health. |
334.10 |
34203.24 |
14.51 |
41.53 |
17.30 |
23.03 |
5.57 |
8.03 |
0.96 |
|
Divi's Lab. |
1110.15 |
29470.99 |
30.25 |
131.67 |
29.05 |
36.70 |
8.27 |
8.43 |
0.90 |
|
Glenmark Pharma. |
876.00 |
24717.76 |
26.45 |
139.83 |
16.83 |
33.12 |
3.39 |
6.27 |
0.23 |
|
Piramal Enterp. |
1383.85 |
23878.33 |
51.43 |
680.15 |
24.05 |
26.91 |
1.96 |
2.04 |
1.26 |
|
Torrent Pharma. |
1370.40 |
23189.91 |
93.89 |
147.18 |
12.42 |
14.60 |
6.29 |
9.29 |
2.57 |
|
Wockhardt |
931.70 |
10296.11 |
28.67 |
309.21 |
31.37 |
32.50 |
9.44 |
3.02 |
0.00 |
|
Natco Pharma |
484.60 |
8440.48 |
8.58 |
68.15 |
47.60 |
56.48 |
6.58 |
7.11 |
1.03 |
|
|
|||||||||
|
Average |
|
|
42.60 |
218.41 |
28.21 |
30.88 |
5.94 |
6.40 |
0.77 |
CONCLUSION AND RECOMMENDATION
With Superior project management skills, focus on measuring and monitoring quality and its planned expansion LUPIN Technologies will be able to grow with a CAGR 20% and Margins improving 200-300 bps. We recommend BUY on the stock at CMP of Rs. 1450 to target of Rs. 1720 (EPS of 59.34x FY17).
RISKS AND CONCERNS
-
In various global markets, the government has been taking several cost effective measures in order to bring down healthcare expenses. Thus, governments are focusing on speedy introduction of generic drugs into the market. This too will benefit Indian pharma companies. However, despite promising outlook, intense competition and consequent price erosion would continue to remain a cause for concern.
-
High and fragmented owing to many small players in the industry.
-
Distributors are increasingly pushing branded products in a bid to earn higher margins.
-
Delay in the approval of key products – gNexium, gWelchol and gRenvela/Renagel
-
Adverse currency movements can bring down revenue in dollars.
FINANCIALS
For the quarter ended 31-Mar-2016, the company has reported Consolidate sales of Rs. 4091.32 Cr., up 21.85% from last quarter Sales of Rs. 3357.66 Cr. and up 33.96% from last year same quarter Sales of Rs. 3054.04 Cr. Company has reported net profit after tax of Rs. 812.21 Cr. in latest quarter.
Top-line grew at 7% YoY due to:
-
US flat YoY due to price erosion offset by growth in base business
-
Japan and South Africa grew strongly in local currency
-
India business grew YoY due to strong performance in chronic therapies
-
EBITDA margins at ~28% and PAT at 16%
-
EBITDA down despite higher R&D
-
spend at 11.7% vs 8.3% in Q3FY15
|
Yearly Income Statement |
2012 |
2013 |
2014 |
2015 |
2016 E |
2017 E |
2018 E |
|
Net Sales |
6959.7 |
9461.63 |
11086.64 |
12599.71 |
13701.56 |
16236.35 |
19035.50 |
|
Other Income |
14.35 |
27.85 |
116.48 |
239.75 |
187.7 |
200.00 |
250.00 |
|
Other Operating Income |
123.21 |
179.67 |
199.93 |
170.3 |
506.91 |
600 |
700 |
|
Total Income |
6974.05 |
9489.48 |
11203.12 |
12839.46 |
13889.26 |
16436.35 |
19285.50 |
|
Total Expenditure |
5638.2 |
7371.41 |
8283.78 |
9150.42 |
10455.02 |
11852.53 |
13800.73 |
|
EBIDTA |
1335.85 |
2118.07 |
2919.34 |
3689.04 |
3434.24 |
4583.81 |
5484.76 |
|
Depreciation |
227.52 |
332.19 |
260.97 |
434.7 |
463.5 |
542.40 |
597.85 |
|
EBIT |
1108.33 |
1785.88 |
2658.37 |
3254.34 |
2970.74 |
4041.41 |
4886.91 |
|
Interest |
35.47 |
40.95 |
26.65 |
9.81 |
44.62 |
27.65 |
26.36 |
|
PBT |
1196.07 |
1924.6 |
2831.65 |
3414.83 |
3433.03 |
4013.77 |
4860.55 |
|
Tax |
308.56 |
584.16 |
962.15 |
970.4 |
1153.58 |
1324.54 |
1555.37 |
|
Deferred Tax |
0 |
0 |
0 |
0 |
0 |
0 |
0 |
|
Adjusted Profit After Tax |
887.51 |
1340.44 |
1869.50 |
2444.43 |
2279.45 |
2689.22 |
3305.17 |
|
Minority Interest After NP |
19.86 |
26.28 |
33.13 |
41.19 |
8.76 |
15.66 |
22.93 |
|
Profit/Loss of Associate Company |
0 |
0 |
0 |
0 |
0 |
0 |
0 |
|
Extra-ordinary Items |
0 |
0 |
0 |
0 |
0 |
0 |
0 |
|
Adjusted Profit After Extra-ordinary item |
867.65 |
1314.16 |
1836.37 |
2403.24 |
2270.69 |
2673.57 |
3282.24 |
|
|
|||||||
|
Equity |
89.33 |
89.51 |
89.68 |
89.9 |
90.12 |
90.12 |
90.12 |
|
EPS (Unit Curr.) |
19.43 |
29.39 |
40.99 |
53.54 |
50.45 |
59.34 |
72.84 |
|
Face Value |
2 |
2 |
2 |
2 |
2 |
2 |
2 |
|
Outstanding Shares |
450,582,969 |
450,582,969 |
450,582,969 |
450,582,969 |
450,582,969 |
450,582,969 |
450,582,969 |
|
|
|||||||
|
EBIDTA Margin |
19.19% |
22.39% |
26.33% |
29.28% |
25.06% |
28.23% |
28.81% |
|
EBIT Margin |
15.92% |
18.87% |
23.98% |
25.83% |
21.68% |
24.89% |
25.67% |
|
PAT Margin |
12.44% |
13.85% |
16.39% |
18.72% |
16.35% |
16.27% |
17.02% |
Balance Sheet
|
SOURCES OF FUNDS: |
2014 |
2015 |
2016 |
|
Share Capital |
89.68 |
89.9 |
90.12 |
|
Reserves & Surplus |
6841.89 |
8784.16 |
10894.25 |
|
Equity Share Warrants |
0 |
0 |
0 |
|
Minority Interest |
66.94 |
24.1 |
32.08 |
|
Loan Funds |
553.34 |
470.98 |
7119.31 |
|
Secured Loan |
0 |
0 |
0 |
|
Unsecured Loan |
0 |
0 |
0 |
|
Foreign Currency Monetary Item Translation Diff. A |
0 |
0 |
0 |
|
Deferred Tax Liability |
248.66 |
202.41 |
204.46 |
|
Other Liabilities |
178.35 |
206.11 |
455.7 |
|
Total Liabilities |
7978.86 |
9777.66 |
18795.92 |
|
APPLICATION OF FUNDS: |
|
||
|
Fixed Assets |
3001.85 |
3296.05 |
8637.92 |
|
Intangible Assets |
657.87 |
1648.11 |
2964.39 |
|
Loans |
0 |
0 |
0 |
|
Investments |
178.47 |
1658.4 |
7.54 |
|
Foreign Currency Monetary Item Translation Diff. A |
0 |
0 |
0 |
|
Current Assets, Loans & Advances |
5924.04 |
6176.46 |
9777.01 |
|
Inventories |
2129.45 |
2503.56 |
3178.74 |
|
Sundry Debtors |
2464.1 |
2656.57 |
4549.81 |
|
Cash & Bank Balance |
797.5 |
481.35 |
837.91 |
|
Other Current Assets |
231.3 |
192.92 |
473.37 |
|
Loans & Advances |
301.69 |
342.06 |
737.18 |
|
Current Liabilities & Provisions |
2227.17 |
3360.08 |
3641.83 |
|
Current Liabilities |
1881.77 |
2785.82 |
2966.07 |
|
Provisions |
345.4 |
574.26 |
675.76 |
|
Net Current Assets |
3696.87 |
2816.38 |
6135.18 |
|
Deferred Tax Assets |
70.81 |
84.2 |
80.6 |
|
Other Assets |
372.99 |
274.52 |
970.29 |
|
Total Assets |
7978.86 |
9777.66 |
18795.92 |
INDUSTRY OUTLOOK
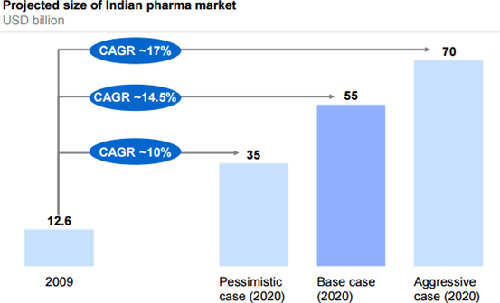
The Indian Pharmaceutical market (IPM) accounts for approx. 1.4% of the global pharmaceutical industry in value terms and 10% in the volume terms. The IPM is valued at Rs 860 bn for the year ending March 2015. The growth in 2015 stood at 12.9%. Owing to robust historical growth and future prospects, many MNC companies have active presence in the Indian pharma space.
The IPM is highly fragmented with about 24,000 players (330 in the organized sector). The top ten companies including domestic and MNC companies make up for more than a third of the market. The market is dominated majorly by branded generics, which constitutes nearly 70% to 80% of market.
Besides the domestic market, Indian pharma companies also have a large chunk of their revenues coming from exports. Major companies are focusing on the generics market in the US, Europe and semi-regulated markets; others are focusing on custom manufacturing for innovator companies. Biopharmaceuticals is also increasingly becoming an area of interest given the complexity in manufacture and limited competition.
The past few years have been glorious ones for the Indian companies, as major blockbusters lost their patent protection, paving way for generics. However, every passing year is leaving lower patented drug opportunities for the Indian companies for the launch of generics. Thus, Indian pharma companies have increased their R&D expenses. The companies are spending more to establish niche product portfolios for the future.
Bulk drug policy - To reduce India’s dependence on China, the government has promised to come out with a bulk drug policy by March. Bulk drugs, or active pharmaceutical ingredients, are the active raw materials used in a drug. India gets more than 75% of its bulk drugs from China. A boost for public sector enterprises, tax-free status for manufacturers and cluster development are likely to be the highlights of the policy.
Online pharmacies - Regulation of the booming business of online pharmacies is also expected. The DCGI has constituted a subcommittee under the chairmanship of Maharashtra Food and Drug Administration commissioner Harshdeep Kamble to frame regulations for online pharmacies. The issue came into the limelight after 800,000 chemists across the country went on a nationwide strike in October against the move by the government to regularize the online sale of medicines.
- Share :


Post a Comment
|
DISCLAIMER |
This report is only for the information of our customers. Recommendations, opinions, or suggestions are given with the understanding that readers acting on this information assume all risks involved. The information provided herein is not to be construed as an offer to buy or sell securities of any kind. ATS and/or its group companies do not as assume any responsibility or liability resulting from the use of such information.