MARUTI SUZUKI INDIA LTD
KEY INFORMATION FOR MARUTI SUZUKI INDIA LIMITED
|
Date |
25-Nov-20 |
|
Market Price (INR) |
7,158 |
|
52Week H/L |
7569.9/4001.1 |
|
Market Cap (INR Bn) |
2,162 |
|
Shares Outstanding (Mn) |
302 |
|
Industry |
Automobiles |
|
Recommendation |
Sell |
|
Target Price |
6,133 |
|
Upside/Downside |
14.32% |
|
Key Financial |
FY20 |
FY21E |
FY22E |
FY23E |
|
Sales |
7,56,106 |
6,73,999 |
7,79,136 |
8,70,535 |
|
Growth (%) |
-11.90% |
-10.86% |
15.60% |
11.73% |
|
EBITDA |
69,775 |
74,657 |
88,045 |
91,815 |
|
Margin (%) |
9.23% |
11.08% |
11.30% |
10.55% |
|
PAT |
52,005 |
57,902 |
67,229 |
69,680 |
|
EPS |
179.8 |
182.9 |
226.8 |
237.1 |
|
Growth (%) |
-30.67% |
11.34% |
16.11% |
3.65% |
|
DPS |
80.0 |
57.5 |
66.8 |
69.2 |
|
ROE (%) |
10.74% |
11.11% |
11.92% |
11.45% |
|
ROCE (%) |
7.11% |
7.71% |
9.03% |
8.43% |
|
EV/EBITDA(x) |
30.8x |
28.7x |
24.4x |
23.4x |
|
P/E(x) |
39.8x |
39.1x |
31.6x |
30.2x |
|
Share Holding Pattern (%) |
|
|
Promoter |
56.4% |
|
FIIs |
21.9% |
|
DIIs |
16.8% |
|
Others |
5.0% |
Several headwinds lie ahead for profit margin expansion
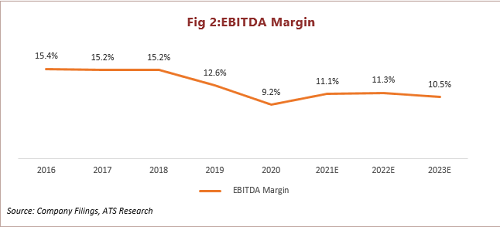
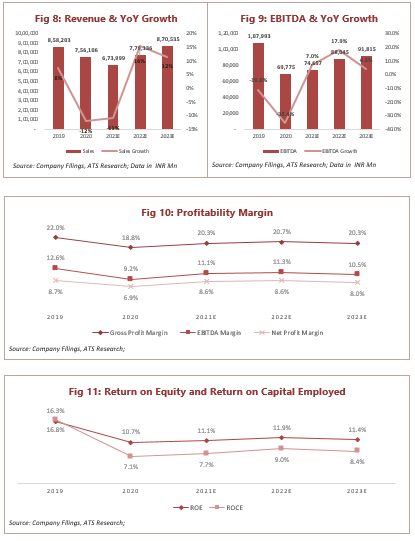
Since 2018, Maruti’s EBITDA margin has been falling and dropped to 9.2% in FY20 due to rise in raw material price and operating expenses. The company posted a 10.3% EBITDA margin, up by 80 bps YoY in the latest quarterly earnings, mainly due to the subdued raw material cost and lower royalty payments.
We expect several headwinds like advertising & promotional cost and rise in raw material prices to put pressure on margin and would remain at an average of 11% for FY21E-FY23E.
Superior challenges seeming in UV segment to sustain the market position but acceleration rate of growth could be lower
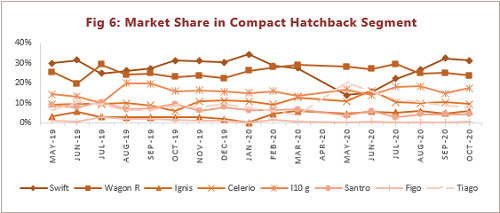
The company has dominance in the Indian auto industry with a market share of ~51%. They have a market share of ~82% in the entry-level segment, ~69% in a compact hatchback, and 51% in the premium hatchback.
However, Maruti has lost its market share in the UV segment, mainly due to competitors’ newly launched products like Venue, Sonet, and Triber. Maruti has been facing steep competition from other players, which puts pressure on the average selling price (ASP) of products and profit margin.
Current growth momentum is mainly due to the festive season demand and personal mobility in the wake of COVID -19. We need to monitor growth post-festive season, we expect an acceleration of growth could be lower. We believe that revenue would grow at a CAGR of 4.8% for FY20-FY23E.
Trading at a richly valued price
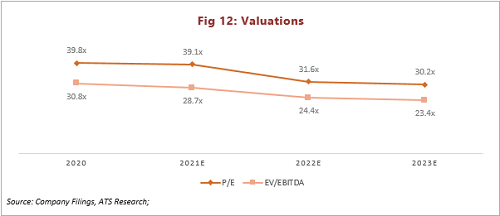
Maruti Suzuki India Ltd stock currently trades at EV/EBITDA 23.4x of FY23E EBITDA. We find the current valuation to be rich since we expect lower single-digit volume growth and mid-digit revenue growth CAGR for FY20-FY23E.
Even key global automotive industry players are on average trading at EV/EBITDA of 15.4x of FY23E EBITDA.
Maruti Suzuki India Limited - Company Profile
Maruti Suzuki India Limited is engaged in the manufacturing, purchase, and sales of 4 wheelers (cars), components, and spare parts. The company’s product portfolio includes S-Presso, Alto 800, Alto K10, Wagon R, Celerio, Ignis, Swift, Dzire, Baleno, Ertiga, XL6, Omni, Eeco, Gypsy, Ciaz, Brezza, S-Cross, and Super carry.
Maruti Suzuki India Ltd also offers services like True Value, Maruti Driving School, Maruti Genuine Parts and Accessories. They have manufacturing capacity in Mehsana, Gujarat, and Manesar-Haryana with a combined capacity of 22.5 Lakhs units per annum.
MANAGEMENT PROFILE
|
Name |
Designation |
|
Kenichi Ayukawa |
CEO & Managing Director |
|
Ravindra Bhargava |
Non – Executive Chairman |
|
Ajay Sheth |
Chief Financial Officer |
|
Rajesh Uppal |
Senior Executive Officer – HR & IT |
|
Davinder Singh Brar |
Independent Non-Executive Director |
|
Osamu Suzuki |
Non-Executive Director |
|
Kenji Saito |
Non-Executive Director |
|
Toshihiro Suzuki |
Non-Executive Director |
|
Rajinder Pal Singh |
Independent Non-Executive Director |
|
Takahiko Hashimoto |
Director – Marketing & Sales |
|
Source: marketscreener.com |
|
Several headwinds lie ahead for Profit margin expansion
Maruti Suzuki (Maruti) posted steady growth in FQ2FY21. Total revenue grew by 10.4% to INR 187 bn. Volumes are up by 16% YoY to 3.93 lakhs units and domestic volumes are up by ~19% to 3.70 lakhs units. Surprisingly, ASP(Average selling price) dropped down by 5.6% to 4.50 lakhs, indicating down trading in the system.
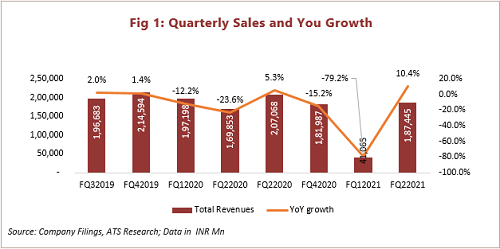
EBITDA margin stood at 10.3% - Up by 80 bps on YoY, leading to EBITDA growth of 20% to INR 193 bn, thanks to a decline in raw material cost and higher other expenses. For this quarter, the discount per vehicle was INR 17,300. Net Profit was up by 1% YoY to INR 13.7 bn mainly due to the lower depreciation rate and the lower tax rate of ~22%.
We believe the operating margin to remain at an average of 11% for the Fy21E-23E, mainly due to a rise in raw material prices and an increase in advertisement cost due to heavy competition.
Superior challenges seeming in UV segment
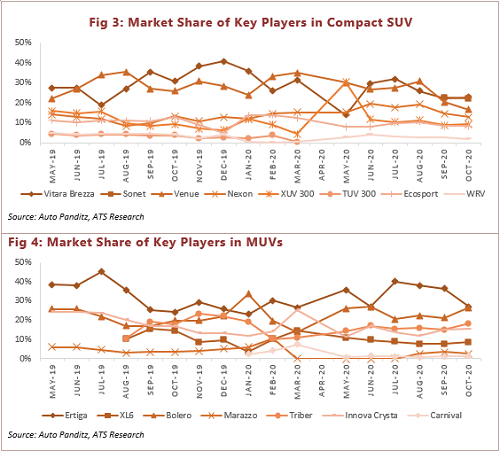
For Maruti Suzuki India Ltd, the share of UVs in total domestic volumes was at 18.2% in H1FY21 v/s 16.6% in FY20. Although there was an improvement in the category mix; the company’s market share in MUV, Compact SUV, and Mid SUV segment was 35.4%, 22.8%, and 6.6%. Their offerings in this category are Brezza, XL6, S-cross, and Ertiga, which are witnessing intense competition from Hyundai&rsquo's Venue and Creta, Kia&rsquo's newly launched Sonet, and Seltos, Tata&rsquo's Nexon and Harrier and MG&rsquo's Hector.
In compact SUV, Maruti is already facing steep competition from Hyundai&rsquo's Venue and Tata&rsquo's Nexon and a newly launched Sonet by Kia. Sonet is eating market share and hurts Maruti&rsquo's share. Thus, the company’s market share has been come down from an average of 30%-31% to 22%-23%.
Maruti&rsquo's commentary suggests that demand for personal mobility is higher as compared to UVs post-COVID, indicating a down trading.
Heavy competition and lower demand could lead to a double blow for Maruti&rsquo's ASP and margin profile.
In the Mid SUV segment, Maruti offers S-Cross, which has a market share of 6%-7%, and they are competing with Hyundai&rsquo's Creta and Kia&rsquo's Seltos, the market leader in this segment with a market share of 36% and 24% respectively. To expand their presence in this segment, the company might have to cut down the product’s price, leading to pressure on margin.
Greater challenges lie ahead in the UV segments, where Maruti is lagging in the industry and new product launches from key competitors are driving lower sales.
Sustain the market position but acceleration rate of growth lower
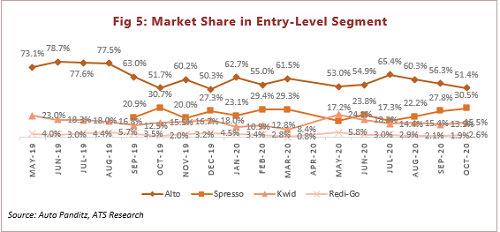
Maruti Suzuki India Ltd is a dominant player in Entry Level, Compact Hatchback, and Premium Hatchback, with a market share of 82%, 70%, and 51%. The company offers Alto and S-presso in the Entry Level segment, competing with Kwid and Redigo. Before the S-press, the company was facing healthy competition from Kwid at the entry-level. Maruti launched S-Presso in Septemeber-2019 and became a dominant player with a decrease in Kwid’s and RediGo’s market share.
We expect that a new product launch from any competitor would be the culprit of market share loss for Maruti in the future.
Maruti has a market share of ~72% in the compact hatchback segment with Swift, WagonR, Celerio, and Ignis. Maruti has No. 1 position and a dominant player with the flagship brand Swift in this segment. Maruti is the only player to offer 4 products in this segment compared to Hyundai’s 2 products and Tata’s Tiago.
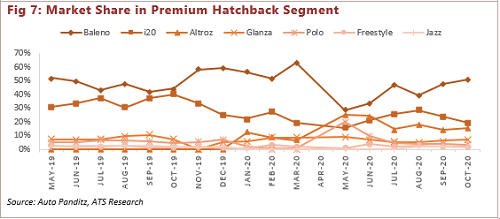
In the premium segment, Baleno is the key and one & only product for Maruti with a market share of ~51%, followed by Hyundai’s i20 (average market share of ~24%) and Tata’s new product Altroz (market share of 16%).
In the post-COVID and Q1 FY21, the Entry-level segment grew by average growth of ~44%. Hatchback segment grew by average growth of ~19%, which shows that the car space has rebounded faster than the two-wheeler segment. This is mainly due to preferred personal mobility, digital marketing done by OEMs, and increased finance availability at a lower interest rate. The festive season demand has also been healthy as per checks with dealers.
Post-November, we need to monitor volume sustainability. With build of 1.35% Volume CAGR for over FY20-FY23E, we expect revenue CAGR of 4.8% for FY20-FY23E.
Normal Earnings Growth led the Muted Return Ration
We expect EBITDA to grow at a 9.6% CAGR due to below-average revenue growth and steep competition. The EBITDA margin would expand 130 bps from 9.2% in FY20 to 10.5% in FY23E, and the average margin for FY21E-FY23E of 11%.
The return of equity (RoE) declined from 20% in FY17 to 16% & 10.7% in FY19 and FY20, mainly due to weak domestic market performance and lower profitability margin.
We expect ROE would not improve much from 10.7% in FY20 to 11.4% in FY23E on the back of lower expectations of earnings growth.
Maruti Suzuki India Limited - Outlook and Valuation
We expect several headwinds for margin expansion, heavy competition, product launches from new players and existing players would lead to single-digit revenue growth and EBITDA growth CAGR of 4.8% and 9.6% for FY20-FY23E, respectively.
Maruti is currently trading at forward EV/EBITDA of 23.4x FY23E, which we believe is a rich valuation.
We have valued the stock at EV/EBITDA of 20x EBITDA of FY23E, a 30% premium valuation from average forward EV/EBITDA of the global automotive industry. We gave a premium valuation mainly due to the higher market share in domestic markets (~51%) and dominance in entry and hatchback segment.
We arrived at the price target of INR 6,133 with a rating of SELL and a downside of 14.3%.
|
Company Name |
FY23E EV/EBITDA |
|
Maruti |
23.4x |
|
M&M |
8.4x |
|
Tata motors |
2.8x |
|
Geely Auto |
10.0x |
|
Great wall Motors |
14.0x |
|
Hyundai |
32.6x |
|
GM |
1.8x |
|
Tesla |
43.3x |
|
Ford |
2.2x |
|
Average |
15.4x |
|
Source: marketscreener.com, ATS Research |
|
Maruti Suzuki India Limited - Key Financials
|
Income Statement |
2019 |
2020 |
2021E |
2022E |
2023E |
|
Sales |
8,58,203 |
7,56,106 |
6,73,999 |
7,79,136 |
8,70,535 |
|
COGS |
6,69,649 |
6,13,686 |
5,37,066 |
6,18,172 |
6,94,022 |
|
Gross Profit |
1,88,554 |
1,42,420 |
1,36,933 |
1,60,964 |
1,76,513 |
|
EBITDA |
1,07,993 |
69,775 |
74,657 |
88,045 |
91,815 |
|
D/A |
30,189 |
35,257 |
34,394 |
37,019 |
40,394 |
|
EBIT |
77,804 |
34,518 |
40,263 |
51,026 |
51,421 |
|
Interest Income |
- |
- |
- |
- |
- |
|
Interest Expenses |
758 |
1,329 |
1,108 |
1,108 |
1,108 |
|
Others non-operating items |
25,610 |
34,208 |
37,032 |
35,724 |
38,451 |
|
EBT |
1,02,656 |
67,397 |
76,187 |
85,642 |
88,764 |
|
Taxes |
29,050 |
14,142 |
18,285 |
18,413 |
19,084 |
|
Tax Rate |
28.3% |
21.0% |
24.0% |
21.5% |
21.5% |
|
Minorities |
- |
- |
- |
- |
- |
|
Adjusted net income |
73,606 |
53,255 |
57,902 |
67,229 |
69,680 |
|
Reported Net Income (Rs mn) |
75,006 |
52,005 |
57,902 |
67,229 |
69,680 |
|
O/S (Mn) |
302.1 |
302.1 |
302.1 |
302.1 |
302.1 |
|
EPS |
258.8 |
179.8 |
182.9 |
226.8 |
237.1 |
|
Balance Sheet |
2019 |
2020 |
2021E |
2022E |
2023E |
|
Cash & Securities |
57,208 |
17,474 |
80,168 |
1,27,784 |
1,70,359 |
|
Trade Receivables |
23,104 |
21,270 |
18,960 |
21,918 |
24,489 |
|
Inventories |
33,257 |
32,149 |
28,135 |
32,384 |
36,358 |
|
Others |
10,047 |
13,381 |
13,381 |
13,381 |
13,381 |
|
Total Current Assets |
1,23,616 |
84,274 |
1,40,644 |
1,95,467 |
2,44,586 |
|
Long Term Investments & Others |
3,15,037 |
3,52,848 |
3,52,848 |
3,52,848 |
3,52,848 |
|
Property, Plant & Equipment, Net |
1,65,568 |
1,60,992 |
1,56,503 |
1,54,484 |
1,59,090 |
|
Intangible Assets and others |
25,097 |
27,407 |
3,117 |
3,117 |
3,117 |
|
Total Assets |
6,29,318 |
6,25,521 |
6,53,112 |
7,05,915 |
7,59,641 |
|
Short-Term Debt |
1,496 |
1,063 |
1,063 |
1,063 |
1,063 |
|
Trade Payables |
96,330 |
74,941 |
65,584 |
75,489 |
84,751 |
|
Other Payables |
43,677 |
36,944 |
36,944 |
36,944 |
36,944 |
|
Total Current Liabilities |
1,41,503 |
1,12,948 |
1,03,591 |
1,13,496 |
1,22,758 |
|
Long-Term Debt |
- |
- |
- |
- |
- |
|
Others |
26,400 |
28,203 |
28,203 |
28,203 |
28,203 |
|
Total Liabilities |
1,67,903 |
1,41,151 |
1,31,794 |
1,41,699 |
1,50,961 |
|
Share Capital |
1,510 |
1,510 |
1,510 |
1,510 |
1,510 |
|
Reserves & Surplus |
4,59,905 |
4,82,860 |
5,19,808 |
5,62,707 |
6,07,169 |
|
Total Shareholders' Equity |
4,61,415 |
4,84,370 |
5,21,318 |
5,64,217 |
6,08,679 |
|
Total Liabilities & Equity |
6,29,318 |
6,25,521 |
6,53,112 |
7,05,915 |
7,59,641 |
|
Cash Flow |
2019 |
2020 |
2021E |
2022E |
2023E |
|
Operating profit |
77,804 |
34,518 |
40,263 |
51,026 |
51,421 |
|
Depreciation & Amortization |
30,189 |
35,257 |
34,394 |
37,019 |
40,394 |
|
Receivables, (Increase) Decrease |
(8,518) |
1,888 |
2,310 |
(2,958) |
(2,571) |
|
Inventories, (Increase) Decrease |
(1,649) |
1,108 |
4,014 |
(4,249) |
(3,974) |
|
Payables, (Decrease) Increase |
8,603 |
21,551 |
(9,357) |
9,904 |
9,263 |
|
Others |
(9,548) |
(45,551) |
37,032 |
35,724 |
38,451 |
|
Operating Free Cash Flow |
96,881 |
48,771 |
1,08,656 |
1,26,467 |
1,32,984 |
|
Interest paid |
(758) |
(1,329) |
(1,108) |
(1,108) |
(1,108) |
|
Interest received |
1,237 |
966 |
- |
- |
- |
|
Direct taxes paid |
(31,428) |
(14,357) |
(18,285) |
(18,413) |
(19,084) |
|
Cashflow before investing activities |
65,932 |
34,051 |
89,263 |
1,06,946 |
1,12,792 |
|
Other investing |
13,318 |
29,720 |
21,385 |
- |
- |
|
Acquisitions |
- |
- |
- |
- |
- |
|
Divestments |
- |
- |
- |
- |
- |
|
Capital Expenditure |
(48,701) |
(34,359) |
(27,000) |
(35,000) |
(45,000) |
|
Cash From Investing Activities |
(35,383) |
(4,639) |
(5,615) |
(35,000) |
(45,000) |
|
Short-Term Debt (Decrease) Increase |
388 |
(433) |
- |
- |
- |
|
Long-Term Debt (Decrease) Increase |
- |
- |
- |
- |
- |
|
Dividends |
(29,134) |
(29,134) |
(20,955) |
(24,330) |
(25,217) |
|
Share Issue / Repurchase |
- |
- |
- |
- |
- |
|
Others |
(732) |
(104) |
- |
- |
- |
|
Cash From Financing Activities |
10,929 |
(69,146) |
(20,955) |
(24,330) |
(25,217) |
|
Free Cash Flow to Equity |
30,549 |
29,412 |
83,648 |
71,946 |
67,792 |
|
Ratio |
2019 |
2020 |
2021E |
2022E |
2023E |
|
EPS |
258.8 |
179.8 |
182.9 |
226.8 |
237.1 |
|
Gross Profit Margin |
22.0% |
18.8% |
20.3% |
20.7% |
20.3% |
|
EBITDA Margin |
12.6% |
9.2% |
11.1% |
11.3% |
10.5% |
|
EBIT Margin |
9.1% |
4.6% |
6.0% |
6.5% |
5.9% |
|
Net Profit Margin |
8.7% |
6.9% |
8.6% |
8.6% |
8.0% |
|
Tax Rate |
28.3% |
21.0% |
24.0% |
21.5% |
21.5% |
|
ROA |
11.9% |
8.3% |
8.9% |
9.5% |
9.2% |
|
ROE |
16.3% |
10.7% |
11.1% |
11.9% |
11.4% |
|
ROCE |
16.8% |
7.1% |
7.7% |
9.0% |
8.4% |
|
P/E |
|
39.8x |
39.1x |
31.6x |
30.2x |
|
EV/EBITDA |
|
30.8x |
28.7x |
24.4x |
23.4x |
|
Days Receivable |
10 |
10 |
10 |
10 |
10 |
|
Days Payable |
53 |
45 |
45 |
45 |
45 |
|
Net Debt/Equity |
-0.1 |
0.0 |
-0.2 |
-0.2 |
-0.3 |
|
Net Debt/EBITDA |
-0.5 |
-0.2 |
-1.1 |
-1.4 |
-1.8 |
|
Growth Ratio |
|
|
|
|
|
|
Sales |
8% |
-12% |
-11% |
16% |
12% |
|
Gross Profit |
0% |
-24% |
-4% |
18% |
10% |
|
EBITDA |
-11% |
-35% |
7% |
18% |
4% |
|
EBIT |
-17% |
-56% |
17% |
27% |
1% |
|
PAT |
-3% |
-31% |
11% |
16% |
4% |
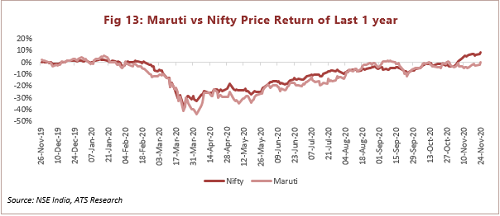
Maruti Suzuki India Limited - Stock Performance
- Share :


Post a Comment
|
DISCLAIMER |
This report is only for the information of our customers. Recommendations, opinions, or suggestions are given with the understanding that readers acting on this information assume all risks involved. The information provided herein is not to be construed as an offer to buy or sell securities of any kind. ATS and/or its group companies do not as assume any responsibility or liability resulting from the use of such information.