NANDAN DENIM
OVERVIEW
Nandan Denim is a family run company managed by Chirpal brothers, Mr. Ved Prakash Chirpal and Mr. Brijmohan Chirpal. The Company is involved in the business of manufacturing, trading and export of textiles. It commenced its operations in the year 1999 and in few years it has become India’s largest producer of denim fabric.
|
|
|
|
CMP as on 8/9/2017 |
151 |
|
52 Week High/Low |
105/162 |
|
Market Cap (Cr) |
724 |
|
Total Debt (FY-17)(Cr) |
465 |
|
Enterprise Value(FY-17)(Cr) |
1123 |
|
Cash and Investment (FY-17)(Cr) |
65 |
|
Equity Capital (Cr) |
45.55 |
|
Face Value |
10 |
|
Share Holding Pattern |
|
|
Promoters&Promoters Group Holding (%) |
58.27 |
|
Public Holding (%) |
41.73 |
|
Grand Total |
100 |
Investment Rationale:
-
Combination of Promising Industry and Industry leader.
-
Expanded capacity.
-
Biggest Beneficiary of Gujrat Textile Policy amongst its peers.
-
Well established customers.
-
Promoters increasing stake.
-
Normal monsoon, 7th pay commission and loan waiver for farmers will increase consumption in the economy.
-
Positive impact of GST.
-
Consistent financial performance and valuation opportunity
Company overview:
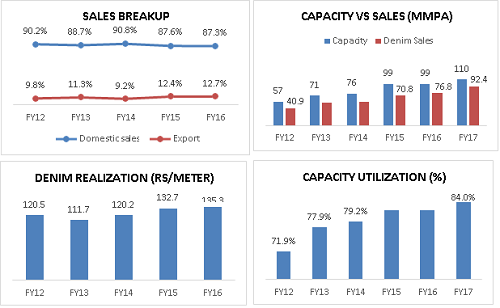
Nandan Denim is India’s largest and world’s 4th largest Denim fabric manufacturing company with present production capacity of 110 million meter per annum (MMPA). It has surpassed Arvind ltd which has a capacity of 108 MMPA.
Product Line:
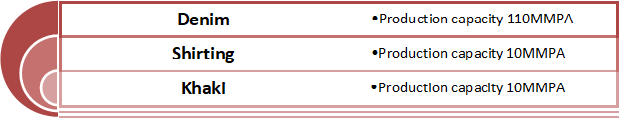
The company has done successful backward integration. In the year 2014, the company has invested in doubling the spinning capacity from 54TPD to 124TPD. Now company has its presence in all the value chain of denim manufacturing.

|
Ginned Cotton |
Spinning |
Weaving and Processing |
|
70% of cotton requirement is procured from Gujrat |
Ring Spinning- 20 TPD |
Denim->110 MMPA |
|
Open End Spinning -44TPD |
Shirting-10MMPA |
Nandan Denim is a supplier to many well renowned brands:

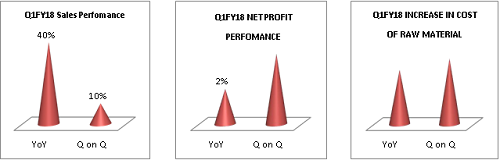
Q1FY 18 Quarterly Performances and Trend:
Company posted a robust increase in sales, an increase of 40% YoY basis. But Net Profit could not match with it due to increase in cost of raw material i.e. cotton. But cotton prices are expected to come down which would benefit the company in next quarter. Company is expected to show good growth in sales as well as net profit in coming quarters.
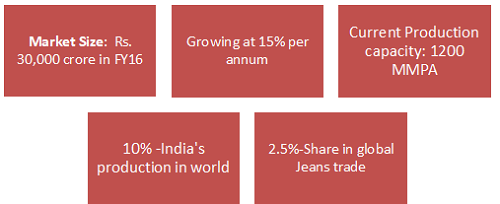
Industry Overview:
Denim Industry in India:
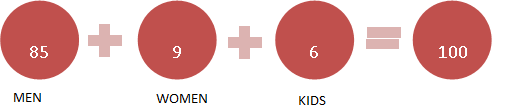
Denim has emerged as the most preferred apparel in India and has witnessed the fastest growth in fabric. Globally, the denim industry market stands at $113 billion in FY17 and is expected to grow to $153 billion by FY20. The Indian denim industry is witnessing a robust growth of CAGR 15%-18% per annum. For majority of Indian youth, denim has become a fashion statement. Fashion in India is influenced by westernization and denim is a symbol of it. Overall we see denim as a very promising industry. Women’s segment is expected to grow fastest. Kids segment in India is garnering a lot of attention off late. About 65% to 70% of the total production is consumed locally.
Key Facts:
Segmentation:
India has a great price advantage as it is the largest producer of cotton, which is the largest raw material and cost for the denim. With good monsoon and increase in production price, cotton prices are expected to get further down. Current per capita consumption of denim in India stands at 0.3 pairs per person compared to 8-9 pairs in developed countries. We can expect industry to grow at 15% further and biggest beneficiary would be industry leader like Nandan Denim.
Denim export from India:
India is one of the major suppliers of denim fabric in the world. India exports 35% of its production and remaining 65% is consumed locally. It is expected to see further growth in the share of export to 45% from current 35%. Denim is the biggest driver of textile sector in India.
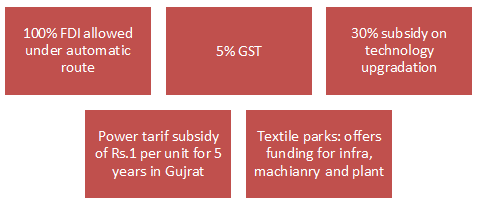
India’s textile policy:
Investment Rationale:
-
Combination of Promising Industry and Industry leader:
Denim has emerged as the most favored apparel wear in India as well as in world fashion. Denim has become preferred choice not just for clothing but for handbags, purses as well as for shoes. Its durability and fashion cult makes it the most preferred ‘all weather suitable’ product. Indian denim industry is poised to grow at CAGR of 15% over the next 5 years. NDL is a market leader in denim, it stands first in India and 4th in world, makes it the biggest beneficiary of growing Indian denim market.
-
Expanded capacity:
In 2014 NDM had announced the capacity expansion by 60% with investment of Rs. 6 billion, which the company will start utilizing in full-fledge from FY18. The results will be seen from Q2 FY18 onwards. Post expansion of spinning capacity, around 85% of cotton yarn requirement will be met internally, which was 50% prior to expansion which would result in 10-15% saving than procuring the cotton yarn from outside. So all in all we can expect company to post good growth in revenue as well as operating margins. Nandan Denim has achieved capacity utilization of 84% in FY17 even after expansion.
-
Biggest Beneficiary of Gujrat Textile Policy amongst its peers:
The Company is Ahmedabad based and 70% cotton requirement is procured from Gujrat only. Gujarat offers the following benefits to Textile industry:
-
Interest Subsidy for 5 years: 7% on spinning and garment facilities on addition 5% by central government.
-
Power tariff subsidy @Rs 1 unit for years.
-
100% stamp duty reimbursement.
-
-
Well established customers:
The Company has strong customer portfolio of well known brands such as Spykar, Mufti, Polo, Colorplus, Tommy Hilfiger, and Being Human.
-
Promoters increasing stake:
On June 30, 2017 Chairman and MD of the company Mr. Vedprakash Chiripal has bought 0.49% of equity shares from open market. It confirms the promoters’ confidence in the company’s future prospects and growth
-
Normal monsoon, 7th pay commission and loan waiver:
All these factors are positive for the consumption companies. Normal mansoon would drive the rural economy growth and reduce the price of cotton as well as overall food inflation which will leave people with more consumption income in hand. 7th pay commission would infuse more than more than 1 lac crore in the Indian economy and large part of it will go for consumption. Loan waiver will increase dispensable income in the hands of rural consumer and reduced gap between lifestyles of rural and urban would help denim industry to grow further.
-
Positive impact of GST :
GST is expected to bring shift in the market share leading to expansion of organized sectors at the cost of unorganized sector. GST would subsume the various taxes like Octroi, entry tax which will result in lower cost for textile manufacturers. One tax across the country would help seamless flow of goods throughout the country and save both time and money. Government has kept cotton textile in lower slab i.e. 5% tax rate which would give impetus for the growth and development of entire textile value chain.
-
Consistent financial performance and valuation opportunity:
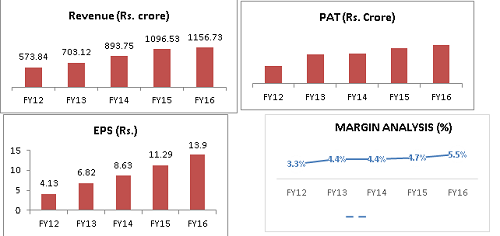
Company has surpassed the company Arvind ltd in production capacity and has emerged as the number one player in denim industry in India. The Company has shown very commendable performance in terms of growth, the Revenue growth of 15.05% from FY12 to FY16 and PAT 28% for the same period. Operating margins has improved from 14.4% in FY12 to 16.5% in FY16 and once company consolidate the process and optimize the capacity we can expect more improvement in the margins.
Company is trading at P/E multiple of 12.69, for industry which is growing at 15% and more company looks undervalued. With good monsoon and surplus production, cotton prices are poised to come down which could help the company to increase margin as cost of raw material is 70% to sales for the company.
Consolidated Balance Sheet FY16:
|
FY12 |
FY13 |
FY14 |
FY15 |
FY16 |
|
|
EQUITIES AND LIABILITIES |
|||||
|
SHAREHOLDER'S FUNDS |
|||||
|
Equity Share Capital |
45.55 |
45.55 |
45.55 |
45.55 |
45.55 |
|
Total Share Capital |
45.55 |
45.55 |
45.55 |
45.55 |
45.55 |
|
Reserves and Surplus |
113.38 |
138.04 |
170.96 |
213.33 |
267.88 |
|
Total Reserves and Surplus |
113.38 |
138.04 |
170.96 |
213.33 |
267.88 |
|
Money Received Against Share Warrants |
0 |
0 |
0 |
0 |
25 |
|
Total Shareholders Funds |
158.93 |
183.59 |
216.51 |
258.88 |
338.43 |
|
NON-CURRENT LIABILITIES |
|||||
|
Long Term Borrowings |
157.84 |
265.09 |
280.7 |
277.72 |
318.24 |
|
Deferred Tax Liabilities [Net] |
20.27 |
17.52 |
21.57 |
24.87 |
22.89 |
|
Long Term Provisions |
0 |
0.02 |
0 |
0 |
0 |
|
Total Non-Current Liabilities |
178.12 |
282.63 |
302.28 |
302.59 |
341.13 |
|
CURRENT LIABILITIES |
|||||
|
Short Term Borrowings |
96.33 |
100.39 |
107.83 |
145.15 |
146.21 |
|
Trade Payables |
34.47 |
45.8 |
57.64 |
68.3 |
84.48 |
|
Other Current Liabilities |
51.83 |
58.59 |
100.9 |
72.02 |
91.4 |
|
Short Term Provisions |
6.28 |
6.44 |
6.55 |
12.92 |
16.08 |
|
Total Current Liabilities |
188.92 |
211.22 |
272.92 |
298.4 |
338.16 |
|
Total Capital And Liabilities |
525.97 |
677.44 |
791.7 |
859.88 |
1017.73 |
|
ASSETS |
|||||
|
NON-CURRENT ASSETS |
|||||
|
Tangible Assets |
300.72 |
340.82 |
452.15 |
436.37 |
479.71 |
|
Intangible Assets |
0.66 |
0.38 |
0.2 |
0.27 |
0.15 |
|
Capital Work-In-Progress |
4.67 |
54.06 |
0 |
10.79 |
90.36 |
|
Fixed Assets |
306.04 |
395.26 |
452.35 |
447.43 |
570.23 |
|
Non-Current Investments |
0.28 |
0.37 |
4.16 |
7.35 |
7.32 |
|
Long Term Loans And Advances |
14.91 |
14.41 |
0.58 |
12.05 |
9.38 |
|
Other Non-Current Assets |
4.63 |
3.02 |
11.75 |
5.47 |
2.17 |
|
Total Non-Current Assets |
325.86 |
413.05 |
468.84 |
472.31 |
589.11 |
|
CURRENT ASSETS |
|||||
|
Inventories |
98.42 |
119.76 |
138.5 |
140.93 |
195.11 |
|
Trade Receivables |
69.47 |
91.17 |
121.42 |
147.23 |
122.24 |
|
Cash And Cash Equivalents |
15.5 |
19.93 |
26.07 |
60.1 |
64.9 |
|
Short Term Loans And Advances |
16.72 |
33.52 |
36.87 |
39.31 |
46.37 |
|
Total Current Assets |
200.11 |
264.39 |
322.86 |
387.57 |
428.62 |
|
Total Assets |
525.97 |
677.44 |
791.7 |
859.88 |
1017.73 |
Consolidated P&L Statement FY17:
|
FY12 |
FY13 |
FY14 |
FY15 |
FY16 |
|
|
Income |
|||||
|
Sales Turnover |
573.84 |
703.12 |
893.75 |
1096.53 |
1156.73 |
|
Net Sales |
573.84 |
703.12 |
893.75 |
1096.53 |
1156.73 |
|
Other Income |
4.82 |
1.53 |
3.99 |
3.04 |
4.15 |
|
Stock Adjustments |
-7.06 |
37.59 |
12.17 |
-21.99 |
23.89 |
|
Total Income |
571.6 |
742.24 |
909.91 |
1077.58 |
1184.77 |
|
Expenditure |
|||||
|
Raw Materials |
408.65 |
542.71 |
658.31 |
759.49 |
811.81 |
|
Power & Fuel Cost |
38.32 |
44.7 |
55.4 |
78.5 |
80.94 |
|
Employee Cost |
19.23 |
25.44 |
31.04 |
43.81 |
54.52 |
|
PBDIT |
87.41 |
108.45 |
136.66 |
168.48 |
195.3 |
|
Interest |
27.84 |
31.76 |
32.03 |
37.71 |
41.17 |
|
PBDT |
59.57 |
76.69 |
104.63 |
130.77 |
154.13 |
|
Depreciation |
33.26 |
40.92 |
49.73 |
59.55 |
66 |
|
Profit Before Tax |
26.31 |
35.77 |
54.9 |
71.22 |
88.13 |
|
PBT (Post Extra-ord Items) |
26.31 |
35.77 |
54.9 |
71.22 |
88.13 |
|
Tax |
7.51 |
4.71 |
15.6 |
19.79 |
24.81 |
|
Reported Net Profit |
18.79 |
31.05 |
39.31 |
51.43 |
63.32 |
|
Total Value Addition |
75.54 |
91.08 |
114.94 |
149.61 |
177.66 |
|
Equity Dividend |
4.55 |
5.47 |
5.47 |
7.29 |
7.29 |
|
Corporate Dividend Tax |
0.74 |
0.93 |
0.93 |
1.39 |
1.48 |
|
Per share data (annualised) |
|||||
|
Shares in issue (lakhs) |
455.49 |
455.49 |
455.49 |
455.49 |
455.49 |
|
Earning Per Share (Rs) |
4.13 |
6.82 |
8.63 |
11.29 |
13.9 |
|
Equity Dividend (%) |
10 |
12 |
12 |
16 |
16 |
|
Book Value (Rs) |
34.89 |
40.31 |
47.53 |
56.84 |
68.81 |
- Share :


Post a Comment
|
DISCLAIMER |
This report is only for the information of our customers. Recommendations, opinions, or suggestions are given with the understanding that readers acting on this information assume all risks involved. The information provided herein is not to be construed as an offer to buy or sell securities of any kind. ATS and/or its group companies do not as assume any responsibility or liability resulting from the use of such information.