Nucleus Software Exports Limited
Nucleus Software Exports Limited - Company Profile
Nucleus Software Exports Limited is a software company providing efficient and cutting-edge software solutions for the Banking and Financial Services industry across the globe. For over 27 years, the company have been developing pioneering solutions that span from Retail Banking to Corporate Banking to Cash Management to Internet Banking.
The extensive portfolio includes FinnOneTM, the Flagship product of Nucleus Software. Awarded the Global No 1 Lending product for 6 consecutive years (IBS Publishing), FinnOneTM is a comprehensive suite providing solutions both on the asset and the liability aspects, core financial accounting and customer service. Some of the modules are Customer Acquisition System, Loan Management, Delinquency and Recovery Management, Deposits and Finance against Securities. The customers for FinnOneTM include Banks, Financial Institutions, Captive auto and retail finance companies.
FinnAxia (A Transaction Banking Product Suite) is a comprehensive web enabled solution from Nucleus Software that caters solves business challenges of players in the area of Cash Management and Transaction banking enabling them to offer their customers a seamless experience. BankONetTM is the Business Internet banking front end Across Retail Consumer, Corporate and Islamic banking businesses, Nucleus Software has aligned development teams, business experts and testing & QA teams who are spending time and efforts in understanding the market challenges and coming up with tailored solutions that cater to specific challenges of our customers.
Nucleus Software is well equipped to serve customers globally through its sales presence across geographies including Europe, US, Asia and Middle East.
Nucleus Software has been a pioneer in the Indian software product industry for almost two decades and is committed to delivering end-to-end solutions and help its customers get to market faster. We have extremely strong relationships with our customers. The success stories spread across 50 countries across the globe and going forward, we will continue working on expanding our base in new/select markets.
The current market capitalization stands at Rs 568.50 crore. The company has reported a consolidated sales of Rs 85.98 crore and a Net Profit of Rs 19.57 crore for the quarter ended Dec 2014.
Nucleus Software Exports Limited - Share Holding Pattern
|
Category |
No. of Shares |
Percentage |
|
Promoters |
19,631,866 |
60.62 |
|
General Public |
7,450,241 |
23.01 |
|
Foreign Institutions |
2,766,918 |
8.54 |
|
NBFC and Mutual Funds |
938,570 |
2.90 |
|
Other Companies |
873,670 |
2.70 |
|
Foreign - NRI |
603,158 |
1.86 |
|
Others |
76,383 |
0.24 |
|
Financial Institutions |
42,918 |
0.13 |
Nucleus Software Exports Limited - Financial Details
-
Market Cap (Rs Cr) – 568.5
-
Company P/E – 11.16
-
Industry P/E – 24.55
-
Book Value (Rs) – 109.81
-
Dividend (%) – 60 %
-
EPS (TTM) – 15.72
-
Dividend Yield (%) – 3.42 %
-
Face Value (Rs) - 10
Industry Information
The Indian IT and Information Technology enabled Services (ITeS) sectors go hand-in-hand in every aspect. The industry has not only transformed India's image on the global platform, but also fuelled economic growth by energizing the higher education sector (especially in engineering and computer science). The industry has employed almost 10 million Indians and, hence, has contributed significantly to social transformation in the country.
India is one of the fastest-growing IT services markets in the world. It is also the world's largest sourcing destination, accounting for approximately 52 per cent of the US$ 124-130 billion market. The country's cost competitiveness in providing IT services continues to be its USP in the global sourcing market.
India has the potential to build a US$ 100 billion software product industry by 2025, according to Indian Software Product Industry Roundtable (iSPIRT).
The Indian IT-BPM industry is expected to add revenues of US$ 13-14 billion to the existing revenues by FY15, according to National Association of Software and Services Companies (NASSCOM).The industry grew at a compound annual growth rate (CAGR) of 13.1 percent during FY08-13.Total exports from the IT-BPM sector (excluding hardware) were estimated at US$ 76 billion during FY13. Export of IT services has been the major contributor, accounting for 57.9 percent of total IT exports (excluding hardware) in FY13. BPM accounted for 23.5 percent of total IT exports during the same fiscal. The IT outsourcing sector is expected to see exports growing by 13-15 per cent during FY15.
The data centre infrastructure market of India is estimated to reach US$ 2.03 billion in 2015, a 5.4 percent increase from US$ 1.92 billion in 2014. According to data released by the Department of Industrial Policy and Promotion (DIPP), the computer software and hardware sector attracted foreign direct investment (FDI) worth US$ 13,238.58 million between April 2000 and September 2014.
Balance Sheet
|
|
Mar '14 |
Mar '13 |
Mar '12 |
Mar '11 |
Mar '10 |
|
Sources Of Funds |
|
|
|
|
|
|
Total Share Capital |
32.39 |
32.39 |
32.38 |
32.38 |
32.37 |
|
Equity Share Capital |
32.39 |
32.39 |
32.38 |
32.38 |
32.37 |
|
Share Application Money |
0.00 |
0.00 |
0.02 |
0.22 |
0.35 |
|
Reserves |
323.22 |
287.09 |
260.21 |
238.28 |
200.24 |
|
Networth |
355.61 |
319.48 |
292.61 |
270.88 |
232.96 |
|
Total Debt |
0.00 |
0.00 |
0.00 |
0.00 |
0.00 |
|
Total Liabilities |
355.61 |
319.48 |
292.61 |
270.88 |
232.96 |
|
|
Mar '14 |
Mar '13 |
Mar '12 |
Mar '11 |
Mar '10 |
|
Application Of Funds |
|
|
|
|
|
|
Gross Block |
90.48 |
79.22 |
87.29 |
85.63 |
88.99 |
|
Less: Accum. Depreciation |
46.55 |
46.09 |
56.35 |
51.46 |
48.39 |
|
Net Block |
43.93 |
33.13 |
30.94 |
34.17 |
40.60 |
|
Capital Work in Progress |
1.26 |
0.00 |
0.00 |
0.00 |
0.00 |
|
Investments |
226.38 |
164.12 |
116.66 |
139.85 |
100.35 |
|
Inventories |
0.00 |
4.95 |
0.00 |
0.00 |
0.00 |
|
Sundry Debtors |
31.93 |
57.29 |
77.74 |
26.13 |
46.57 |
|
Cash and Bank Balance |
71.99 |
90.47 |
3.08 |
6.15 |
5.13 |
|
Total Current Assets |
103.92 |
152.71 |
80.82 |
32.28 |
51.70 |
|
Loans and Advances |
84.63 |
64.80 |
72.40 |
75.57 |
53.63 |
|
Fixed Deposits |
0.00 |
0.00 |
70.66 |
40.34 |
38.65 |
|
Total CA, Loans & Advances |
188.55 |
217.51 |
223.88 |
148.19 |
143.98 |
|
Current Liabilities |
67.43 |
69.95 |
56.36 |
30.50 |
32.34 |
|
Provisions |
37.08 |
25.34 |
22.50 |
20.81 |
19.62 |
|
Total CL & Provisions |
104.51 |
95.29 |
78.86 |
51.31 |
51.96 |
|
Net Current Assets |
84.04 |
122.22 |
145.02 |
96.88 |
92.02 |
|
Total Assets |
355.61 |
319.47 |
292.62 |
270.90 |
232.97 |
|
Contingent Liabilities |
3.63 |
6.61 |
0.49 |
0.18 |
0.18 |
|
Book Value (Rs) |
109.81 |
98.65 |
90.35 |
83.58 |
71.86 |
Profit and Loss Account
|
|
Mar '14 |
Mar '13 |
Mar '12 |
Mar '11 |
Mar '10 |
|
Income |
|
|
|
|
|
|
Sales Turnover |
241.11 |
202.28 |
204.85 |
199.55 |
194.15 |
|
Net Sales |
241.11 |
202.28 |
204.85 |
199.55 |
194.15 |
|
Other Income |
29.94 |
23.99 |
22.14 |
30.46 |
6.78 |
|
Total Income |
271.05 |
226.27 |
226.99 |
230.01 |
200.93 |
|
Expenditure |
|
|
|
|
|
|
Power & Fuel Cost |
3.89 |
3.40 |
2.96 |
2.20 |
0.39 |
|
Employee Cost |
124.80 |
117.58 |
115.90 |
21.77 |
15.76 |
|
Other Manufacturing Expenses |
17.00 |
8.14 |
17.31 |
130.96 |
125.67 |
|
Selling and Admin Expenses |
0.00 |
0.00 |
32.95 |
12.77 |
7.89 |
|
Miscellaneous Expenses |
50.49 |
42.19 |
8.52 |
5.92 |
2.89 |
|
Total Expenses |
196.18 |
171.31 |
177.64 |
173.62 |
152.60 |
|
Operating Profit |
44.93 |
30.97 |
27.21 |
25.93 |
41.55 |
|
PBDIT |
74.87 |
54.96 |
49.35 |
56.39 |
48.33 |
|
Interest |
0.35 |
0.30 |
0.22 |
0.22 |
0.27 |
|
PBDT |
74.52 |
54.66 |
49.13 |
56.17 |
48.06 |
|
Depreciation |
6.76 |
4.97 |
6.10 |
8.10 |
9.80 |
|
Profit Before Tax |
67.76 |
49.69 |
43.03 |
48.07 |
38.26 |
|
Extra-ordinary items |
0.00 |
0.00 |
-0.09 |
-0.14 |
1.49 |
|
PBT (Post Extra-ord Items) |
67.76 |
49.69 |
42.94 |
47.93 |
39.75 |
|
Tax |
12.67 |
12.59 |
10.30 |
2.18 |
5.98 |
|
Reported Net Profit |
55.09 |
37.09 |
32.64 |
45.76 |
33.74 |
|
Total Value Addition |
196.18 |
171.32 |
177.64 |
173.62 |
152.60 |
|
Equity Dividend |
19.43 |
9.72 |
8.10 |
8.10 |
8.09 |
|
Corporate Dividend Tax |
1.71 |
1.16 |
0.73 |
-0.01 |
0.15 |
|
Per share data (annualised) |
|
|
|
|
|
|
Shares in issue (lakhs) |
323.84 |
323.84 |
323.83 |
323.83 |
323.70 |
|
Earning Per Share (Rs) |
17.01 |
11.45 |
10.08 |
14.13 |
10.42 |
|
Equity Dividend (%) |
60.00 |
30.00 |
25.00 |
25.00 |
25.00 |
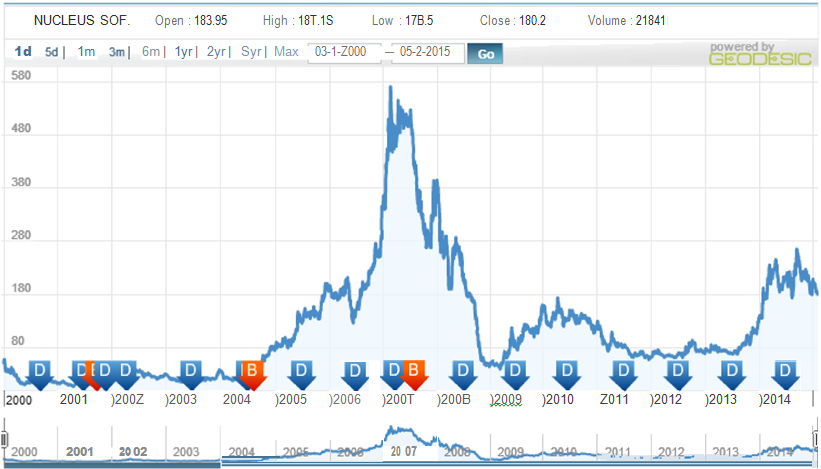
Dividend and Bonus History
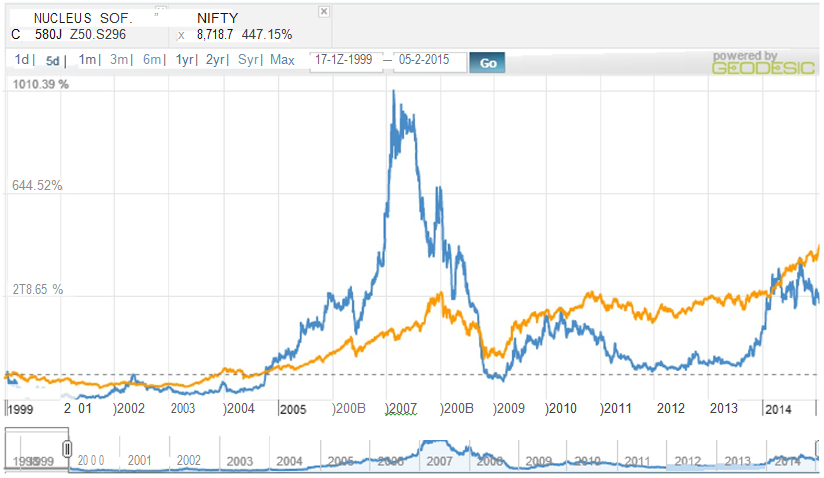
Index and Company Comparison
Important Ratios
-
PBIT – 14.08 v/s 11.48
-
RoCE – 19.15 v/s 15.64
-
RoE – 16.32 v/s 12.12
-
Net Profit Margin – 20.32 v/s 16.39
-
Return on net worth – 15.49 v/s 11.6
-
D/ E Ratio – Nil
-
Interest Cover – 194.6 v/s 167.28
-
Current Ratio – 1.8 v/s 2.28
-
Reserves – 323.22 cr v/s 287.09 cr
-
PAT – 55.09 cr v/s 37.09 cr
-
Total assets – 355.61 cr v/s 319.47 cr
-
Net sales – 241.11 cr v/s 202.28 cr
-
Book Value – 109.81 v/s 98.65
Simple Moving Average
|
Days |
BSE |
NSE |
|
30 |
191.80 |
191.61 |
|
50 |
195.30 |
195.22 |
|
150 |
210.17 |
210.06 |
|
200 |
209.81 |
209.73 |
Recommendations
Buy Nucleus Software Ltd at current or lower market levels
Reasons for the recommendations are :
-
Sound financial position and healthy ratios
-
Availability of top in the industry products and clients.
-
Huge difference in profit margins when compared with its peers.
-
Zero debt company.
-
Launch of new products will add to the sales.
-
Growth in the banking industry and higher exchange rates will increase profits.
-
Availability of reserves and quick cash flow.
- Share :


Post a Comment
|
DISCLAIMER |
This report is only for the information of our customers. Recommendations, opinions, or suggestions are given with the understanding that readers acting on this information assume all risks involved. The information provided herein is not to be construed as an offer to buy or sell securities of any kind. ATS and/or its group companies do not as assume any responsibility or liability resulting from the use of such information.