Persistent Systems Limited
|
Industry |
Market Price |
Recommendation |
Target |
Time Horizon |
|
Computers – Software |
4490 |
Buy |
5400 |
1 Year |
Persistent Systems Limited - Q3 FY21 Review
Persistent Systems Limited reported a net turnover of Rs 1,351 crore for the quarter ended Sept 30, 2021, when compared to Rs 1,007 crore for the quarter ended Sept 30, 2020. EBIT and Profit After Tax was Rs 224 crore and Rs 161 crore for the quarter ended Sept 30, 2021, as compared to Rs 166 crore and Rs 102 crore during the corresponding quarter of the previous year.
Persistent Systems Limited - Investment Summary
|
CMP (Rs) |
4490 |
|
52 Week H/L |
482/4987 |
|
Market Cap (Cr) |
34,309 |
|
Face Value (Rs) |
10.00 |
|
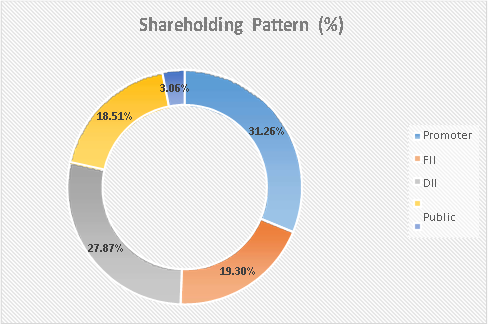
Promoter Holding (%) |
31.26 |
|
Non-Promoter Holding (%) |
68.74 |
|
Total (%) |
100.00 |
Persistent Systems Limited - Overview
-
30+ years of leadership - software engineering & digital transformation
-
Highest customer experience scores in IT industry, rated by ISG
-
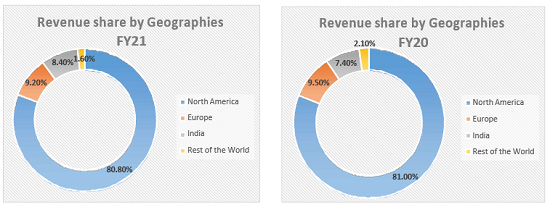
Strong presence in North America
-
Strong revenue growth of 9% QoQ for two consecutive quarters
-
Strong headcount addition of 47% YoY
-
Acquisition of SCI & Shree Partners to improve competitive abilities
Persistent Systems Limited - Quarterly Summary
|
Quarterly (Cr) |
Sep-2021 |
Jun-2021 |
Mar-2021 |
Dec-2020 |
Sep-2020 |
|
Sales |
1351 |
1230 |
1113 |
1075 |
1007 |
|
Other Income |
32 |
38 |
40 |
30 |
16 |
|
Total Income |
1383 |
1268 |
1153 |
1105 |
1023 |
|
Total Expenditure |
1159 |
1067 |
965 |
923 |
857 |
|
EBIT |
224 |
201 |
188 |
182 |
166 |
|
Interest |
2.1 |
2.3 |
1.6 |
1.4 |
1.4 |
|
Tax |
55.9 |
51.8 |
47.1 |
44.1 |
35.5 |
|
Net Profit |
161.8 |
151.2 |
137.8 |
120.9 |
102 |
Business
Persistent Systems Limited is a global technology company with specialization in software products services and technology information. The company offers services across all the stages of the product life cycle, which enables the company to have customers over a wide range. The customer base of the company enables it to develop, enhance and deploy the software products. Persistent Systems’ existence dates back to 1990 and in the three decades of its existence, it has spread its services across industries like BFSI, Healthcare, Telecom & Media, Industrial, and Software & Hi-Tech. The company has its offices across the world, in 18 countries and has customers spread across North America, Europe and Asia.
Over the last three decades, Persistent Systems Limited forged relationships with its customers to develop products across all aspects of the product life cycle. The company provides customers product engineering services and joint product development with revenue–share models. This allows the company to focus on the business of software and enterprises that are becoming software-driven. The company’s core strength lies in software engineering and R&D. Persistent Systems helps its customers in building next-gen products using its core strength.
Persistent Systems represents the operating segments from three industry lines. The industry lines are Banking, Financial Services and Insurance (BFSI), Healthcare and Life Sciences and Technology Companies and Emerging Technologies. The industry line BFSI of the company realized segmental revenue of around Rs 1,285.7 crore in FY21, contributing 30.7% towards the total revenue of the company. In FY20, this industry line brought in a revenue of Rs 1,050.6 crore, contributing 29.46% towards the total revenue. BFSI industry line saw a growth of 22.37% in FY21 over the last year. The segmental operating revenue from BFSI also increased by 33.91% when compared to the last year.
Segmental revenue from the industry line Healthcare & Lifesciences was around Rs 810.4 crore in FY21, contributing 19.35% towards the total revenue of the company. In FY20, this industry line brought in a revenue of Rs 671.2 crore, contributing 18.82% towards the total revenue. Healthcare & Lifesciences industry line saw a growth of 20.61% in FY21 over the last year. The segmental operating revenue from Healthcare & Lifesciences also increased by 37.32% when compared to the last year. Segmental revenue from Technology Companies and Emerging Technologies was around Rs 2,091.74 crore in FY21, contributing 49.95% towards the total revenue of the company. In FY20, this industry line brought in a revenue of Rs 1,843.2 crore, contributing 51.7% towards the total revenue. This line saw a growth of 13.48% in FY21 over the last year. The segmental operating revenue from Healthcare & Lifesciences also increased by 0.49% when compared to the last year.
In September 2021, the company announced its plans to acquire two companies – North Carolina based Software Corporation International (SCI) and New Jersey based Shree Partners, along with their respective subsidiaries. SCI’s acquisition is expected to enhance the company’s existing capabilities and to form the foundation for the company’s dedicated payments business unit announced in September 2021. Shree Partners’ capabilities in digital transformations and technology solutions expand the company’s cloud and IT infrastructure capabilities in BFSI and Travel & Hospitality and also increase its presence in North Carolina and NCR, Delhi.
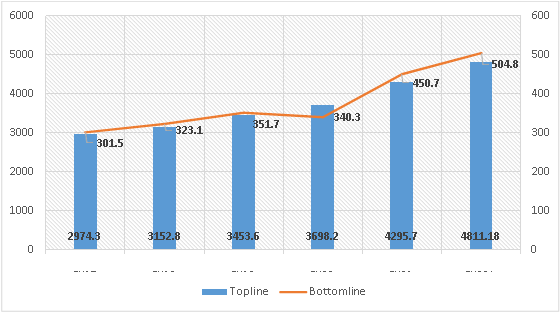
Revenue Trend
Topline and Bottomline trend (Crores)
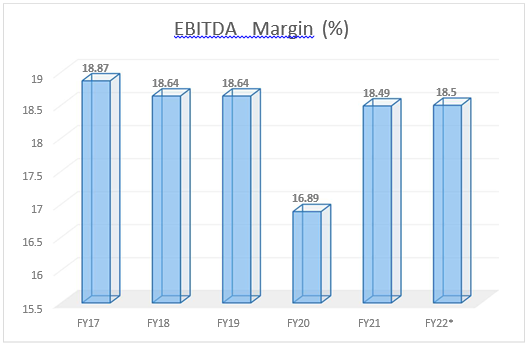
EBITDA Margin Trend (%)
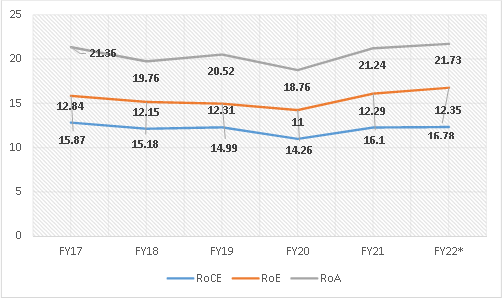
ROE, ROCE, and Asset Turnover trend (%)
Shareholding Pattern (%)
Top 10 Shareholders
|
Rank |
Name |
Holdings % |
|
1 |
Anand Suresh Deshpande |
29.90 |
|
2 |
HDFC Trustee Company Ltd |
5.78 |
|
3 |
Kotak Emerging Equity Scheme |
4.09 |
|
4 |
L&T Mutual Fund |
2.31 |
|
5 |
Ppfas Mutual Fund |
1.98 |
|
6 |
ICICI Prudential Technology Fund |
1.6 |
|
7 |
Axis Mutual Fund |
1.51 |
|
8 |
Ashutosh Vinayak Joshi |
1.46 |
|
9 |
Shridhar Balchandra Shukla |
1.44 |
|
10 |
Nippon Life India Trustee ltd |
1.11 |
Ratio Analysis
|
Year-end March |
FY17 |
FY18 |
FY19 |
FY20 |
FY21 |
|
Per share data (Rs) |
|
|
|
|
|
|
Basic EPS |
37.7 |
40.4 |
44 |
44.4 |
59 |
|
Diluted EPS |
37.7 |
40.4 |
44 |
44.4 |
59 |
|
Cash EPS |
56.3 |
60.2 |
64.3 |
66.2 |
81.9 |
|
BV/Share |
237.4 |
265.9 |
296.3 |
312.2 |
365.8 |
|
P/E |
15.97 |
17.17 |
14.3 |
12.41 |
32.7 |
|
Dividend/share |
- |
10 |
11 |
12 |
20 |
|
Net Profit/share |
37.7 |
40.4 |
44.4 |
44.5 |
59 |
|
Profitability Ratios (%) |
|
|
|
|
|
|
EBDIT Margin (%) |
19.49% |
19.37% |
19.12% |
17.51% |
18.88% |
|
EBIT Margin (%) |
14.31% |
14.15% |
14.45% |
12.86% |
14.69% |
|
PBT Margin (%) |
13.91% |
14.14% |
14.44% |
12.68% |
14.55% |
|
Net Profit Margin (%) |
10.47% |
10.64% |
10.44% |
9.54% |
10.76% |
|
Return on Assets (%) |
12.84% |
12.15% |
12.31% |
11% |
12.29% |
|
Total Debt/Equity (X) |
0 |
0 |
0 |
0 |
0 |
|
Asset Turnover Ratio (%) |
122.67% |
114.09% |
117.87% |
115.31% |
114.25% |
|
Liquidity Ratios (%) |
|
|
|
|
|
|
Current Ratio (X) |
3.4 |
3.6 |
3.9 |
3.1 |
3.5 |
|
Quick Ratio (X) |
3.4 |
3.6 |
3.9 |
3.1 |
3.5 |
|
Inventory Turnover Ratio (X) |
- |
- |
- |
- |
- |
|
Dividend Payout Ratio NP (%) |
15.92% |
24.76% |
25.02% |
33.68% |
23.74% |
|
Dividend Payout Ratio CP (%) |
10.65% |
16.61% |
17.29% |
22.64% |
17.08% |
|
Earnings Retention Ratio (%) |
84.08% |
75.24% |
74.98% |
66.32% |
76.26% |
|
Cash Earnings Retention Ratio (%) |
89.35% |
83.39% |
82.71% |
77.36% |
82.92% |
|
Valuation Ratios (X) |
|
|
|
|
|
|
Enterprise Value (Cr.) |
4,616 |
5,285 |
4,338 |
3,758 |
13,687 |
|
Market Cap/Sales (X) |
1.7 |
1.8 |
1.5 |
1.2 |
3.5 |
|
Price/BV (X) |
2.5 |
2.6 |
2.1 |
1.8 |
5.2 |
Financial Overview
Profit and Loss Statement (crore)
|
Year-end March |
FY17 |
FY18 |
FY19 |
FY20 |
FY21 |
|
INCOME (Cr.) |
|
|
|
|
|
|
Revenue From Operations [Gross] |
2,878.4 |
3,033.7 |
3,365.9 |
3,565.8 |
4,187.9 |
|
Less: Excise/Service Tax/Other Levies |
0 |
0 |
0 |
0 |
0 |
|
Revenue From Operations [Net] |
2,878.4 |
3,033.7 |
3,365.9 |
3,565.8 |
4,187.9 |
|
Total Operating Revenues |
2,878.4 |
3,033.7 |
3,365.9 |
3,565.8 |
4,187.9 |
|
Other Income |
95.8 |
119.1 |
87.7 |
132.4 |
107.8 |
|
Total Revenue |
2,974.3 |
3,152.8 |
3,453.6 |
3,698.2 |
4,295.7 |
|
EXPENSES |
|
|
|
|
|
|
Cost Of Materials Consumed |
0 |
0 |
0 |
0 |
0 |
|
Purchase Of Stock-In Trade |
0 |
0 |
0 |
0 |
0 |
|
Changes In Inventories Of FG,WIP And Stock-In Trade |
0 |
0 |
0 |
0 |
0 |
|
Employee Expenses |
1,764.9 |
1,831.6 |
1,925 |
2,155.6 |
2,515.8 |
|
Depreciation And Amortization Expenses |
149 |
158.5 |
157.3 |
166 |
175.6 |
|
Other Expenses |
430.4 |
415.3 |
535.7 |
526 |
432.7 |
|
Total Expenses |
2,562.2 |
2,723.5 |
2,967.3 |
3,245.8 |
3,686.2 |
|
Profit/Loss Before Tax |
400.7 |
429.3 |
486.3 |
452.3 |
609.4 |
|
Total Tax Expenses |
99.2 |
106.2 |
134.7 |
112.1 |
158.8 |
|
Profit/Loss After Tax Before Extraordinary Items |
301.5 |
323.1 |
351.7 |
340.3 |
450.7 |
|
Profit/Loss For The Period |
301.5 |
323.1 |
351.7 |
340.3 |
450.7 |
Cash Flow Statement (crore)
|
Year-end March |
FY17 |
FY18 |
FY19 |
FY20 |
FY21 |
|
Net Profit Before Tax |
400.7 |
429.3 |
486.3 |
452.3 |
609.4 |
|
Net Cash From Operating Activities |
286.4 |
421.2 |
432.3 |
351.6 |
735.9 |
|
Net Cash (used in)/from Investing Activities |
-221.9 |
-347.4 |
-225.9 |
-14.8 |
-541.7 |
|
Net Cash (used in)/from Financing Activities |
-58.4 |
-95.6 |
-159.6 |
-329.1 |
-144.3 |
|
Net Cash and Cash Equivalents |
6.1 |
-21.8 |
46.8 |
7.6 |
50 |
|
Opening Cash & Cash Equivalents |
140.1 |
146.3 |
134.5 |
173.9 |
190 |
|
Closing Cash & Cash Equivalents |
146.3 |
134.5 |
173.9 |
190 |
241.9 |
Balance Sheet (crore)
|
As on 31-03-2021 |
FY17 |
FY18 |
FY19 |
FY20 |
FY21 |
|
EQUITIES AND LIABILITIES |
|
|
|
|
|
|
SHAREHOLDER'S FUNDS |
|
|
|
|
|
|
Equity Share Capital |
80 |
80 |
79.1 |
76.4 |
76.4 |
|
Total Share Capital |
80 |
80 |
79.1 |
76.4 |
76.4 |
|
Reserves and Surplus |
1,819.3 |
2,047.2 |
2,265.6 |
2,280.3 |
2,672.2 |
|
Total Reserves and Surplus |
1,819.3 |
2,047.2 |
2,265.6 |
2,280.3 |
2,672.2 |
|
Total Shareholders’ Funds |
1,899.3 |
2,127.2 |
2,344.7 |
2,358.8 |
2,795.7 |
|
NON-CURRENT LIABILITIES |
|
|
|
|
|
|
Deferred Tax Liabilities [Net] |
11.7 |
27 |
0 |
0 |
0 |
|
Other Long Term Liabilities |
2 |
0 |
0 |
35.3 |
71.6 |
|
Long Term Provisions |
14.6 |
16 |
25.3 |
18.3 |
24.1 |
|
Total Non-Current Liabilities |
29.8 |
44.7 |
26.5 |
58.2 |
100.1 |
|
CURRENT LIABILITIES |
|
|
|
|
|
|
Trade Payables |
120.9 |
167.3 |
151.7 |
224.7 |
273.3 |
|
Other Current Liabilities |
157.2 |
159.7 |
164.1 |
262.4 |
248.6 |
|
Short Term Provisions |
139.1 |
159.9 |
168.6 |
161.1 |
247.8 |
|
Total Current Liabilities |
417.3 |
487 |
484.4 |
648.2 |
769.7 |
|
Total Capital And Liabilities |
2,346.4 |
2,658.9 |
2,855.6 |
3,092.2 |
3,665.5 |
|
ASSETS |
|
|
|
|
|
|
NON-CURRENT ASSETS |
|
|
|
|
|
|
Fixed Assets |
557.3 |
509.7 |
424.2 |
453 |
460.5 |
|
Total Non-Current Assets |
942.5 |
896.9 |
965.6 |
1,106.6 |
995.2 |
|
CURRENT ASSETS |
|
|
|
|
|
|
Total Current Assets |
1,403.9 |
1,762 |
1,890 |
1,985.6 |
2,670.3 |
|
Total Assets |
2,346.4 |
2,658.9 |
2,855.6 |
3,092.2 |
3,665.6 |
Industry Overview
In the last decade, the IT industry grew five times in terms of revenue. IT-Business Process Management (BPM) is the largest private sector employer in India. India is the leading sourcing destination across the world and captures around 55% of the total global sourcing business (USD 200-250 billion). This industry contributed to 8% of India’s GDP in 2020 and is expected to contribute 10% to India’s GDP by 2025. According to Software Technology Park of India (STPI), the IT exports in the first quarter of FY22 stood at Rs 1.2 lakh crore. According to Gartner estimates, Indian IT spending is expected to reach USD 98.5 billion in FY22. The Indian software product industry is estimated to reach USD 100 billion by 2025.
Indian IT companies are expanding their footprint across the globe by acquiring off-shore companies, to enhance their global delivery centers. Similarly, the major countries have significantly invested in Indian IT. Over the last 21 years, Indian computer software and hardware sector attracted foreign direct investment (FDI) worth USD 74.12 billion. Japanese Investments in the IT sector increased 4X between 2016 and 2020 and stood at USD 9.2 billion in FY21. Indian IT-BPM industry is well diversified across all verticals ranging from BFSI to telecom and media.
India has the largest qualified talent pool of technical skilled manpower in the world. Low-cost human resources, when compared to other countries make India a favorable destination for outsourcing global projects. In Union Budget 2021, the Central government allocated Rs 3,108 crore to the IT and telecom sector. The Indian government extended tax holidays to the IT sector for STPIs and Special Economic Zones (SEZs). In August 2021, the Ministry of State for Electronics and IT announced that the IT export would reach USD 400 billion by the end of FY22. The government plans to increase its focus in areas such as cybersecurity, hyper-scale computing, artificial intelligence and blockchain technology.
In the year 2021, India saw the most number of unicorns and stood as the third largest number of unicorns adding country after the US and China. Commerce and Industry Minister Piyush Goyal gave a target of 75 unicorns for 2022. The pandemic in 2020 increased the reliance of the world on IT, and this led to enormous growth potential for the IT industry in India and across the world. National Software Product Policy 2019 was launched with the aim to develop India as the global software product hub. This policy aimed to help the industry grow at a CAGR of 40% to reach USD 70-80 billion by 2025, by creating new employment opportunities for 35 lakh people. The Indian states are also implementing IT favorable policies to attract FDIs and talent pool.
The trends witnessed in the IT industry are availability of high-speed internet at low cost, cloud computation, e-governance, and green communication. Advanced technologies are emerging and changing the dynamics of the world at a rapid pace. Some of the technologies that are disrupting the industry are Artificial Intelligence, Internet of things (IoT), Robotics, Blockchain technology, Machine Learning, Virtual Reality, 3D Printing and Immersive Media.
Peer Comparison
|
Company Name |
TTM PE |
PB Ratio |
Debt to Equity |
CMP |
Mkt Cap (Cr) |
|
Persistent Systems |
60.1 |
12.5 |
0 |
4,495 |
34,357 |
|
TCS |
39.66 |
16.65 |
0 |
3,922 |
14,49,288 |
|
Infosys |
37.48 |
10.25 |
0 |
1,862 |
7,82,665 |
|
Wipro |
31.48 |
6.97 |
0 |
696 |
3,81,581 |
|
HCL Tech |
31.55 |
6.06 |
0 |
1,341 |
3,63,888 |
Recommendation Rationale
Persistent Systems Limited, with over three decades of presence in the IT industry, has a strong customer base across the world, mainly in North America. Customers from North America contribute to around 80% of the company’s total revenue. The company’s business grew at a consistent rate, which is reflected in its revenue increase from Rs 2,878 crore in FY17 to Rs 4,187 crore in FY21. Persistent Systems creates an ecosystem with its partners’ network to create a competitive advantage for the business. Some of the major partners of the company include IBM, Salesforce, AWS, Red hat, Microsoft, DataStax and Google Cloud. The company received various awards and recognition for its excellent services to the customers. Persistent Systems was recognized as the leader for Customer Excellence across its core service delivery, by Information Services Group (ISG), based on feedback given by 100+ company’s clients.
The company drives its growth both organically and inorganically. As a part of its organic approach, the company looks to increase its customer base and book longer-term deals. The company serves around 350+ clients annually. The number of customers in the categories of $5 million and $1 million went up from 17 and 66 respectively, in Q1 of FY22 to 21 and 76 respectively in Q2 of FY22. The company announced the acquisition of North Carolina based Software Corporation International (SCI) and New Jersey based Shree Partners, along with their respective subsidiaries, as a part of the company’s inorganic strategy. This acquisition increases the company’s presence in North America and India. Both the acquisitions together add around $25 million, 4.4% of the company’s revenue and are gross margin accretive.
Persistent Systems has a strong order book, the deal pipeline remains healthy, as the company participated in larger deals. The company has an annual contract value worth $93.5 million, including renewals and as well as new bookings, across existing and new customers. The management’s focus on building long-term engagements with its clients will support near-term revenue growth and mid-term margin trajectory. The company is strategically aligned to its top client IBM, focusing on the hybrid cloud market. It forged a long-term relationship with several clients like Microsoft, IBM, Red hat and AWS.
The company faces the risk of revenue concentration and dependency on its top clients. In FY21, the company realized 22% and 43.2% of its total revenue from its top 1 client and top 5 clients respectively, while its top 10 customers contributed to around 51.7% of the revenue. The company reduced the dependency on its top clients by significantly increasing their revenue from new customers. In FY22, the company realized around 18.4% and 38.7% of the total revenue from its top 1 client and top 5 clients respectively. The contribution of its top 10 clients to the total revenue has also reduced to 47.7% in FY22.
The industry on whole has faced headwinds and tailwinds in the form of high attrition rate and revenue growth respectively. In order to address the problem of a high attrition rate, the company has increased wages and also significantly increased the hiring over the last few quarters. Continued strong hiring over the last year led to 47% YOY growth in the number of employees. The company plans to add a total of 2000 freshers in FY22. The tailwind of revenue growth resulted in the shortage of supply of digital technology oriented-skilled personnel.
Valuation
Persistent Systems Limited delivered a strong performance, with EBITDA margin growing to 18.41% in FY21 from 16.89% in FY20. Net Profit grew from Rs 300 crore in FY17 to Rs 450 crore in FY21. The company aims to achieve a $ 1 billion revenue run-rate in the next 6-8 quarters, implying a CQGR of 4.6% - 6.5%. Strong demand, healthy deal intake, strong execution, M&A activities are expected to drive the expected CQGR. Higher ESOP expenses are also expected to reduce in the third quarter of FY22 by 60bps q-o-q to 16%. The company’s EPS is increasing at a good rate and it had an EPS of 59 in the last year. The company is currently trading at a P/B ratio of 12.28. We expect the company to perform better in the coming quarters, led by strong demand, additional revenue contribution from acquisitions, and strong seasonality in IP-led business. Valuing the stock at an expected P/E of 72 on TTM EPS of Rs 75, we initiate coverage on Persistent Systems with Buy and a 1-year Target price of Rs 5400. Institutional investors have decreased their holdings in the company to 23.98% from 26.35% in the quarter of September 2021. BUY
- Share :


Post a Comment
|
DISCLAIMER |
This report is only for the information of our customers. Recommendations, opinions, or suggestions are given with the understanding that readers acting on this information assume all risks involved. The information provided herein is not to be construed as an offer to buy or sell securities of any kind. ATS and/or its group companies do not as assume any responsibility or liability resulting from the use of such information.