PUNJAB NATIONAL BANK
Punjab National Bank - Company Profile
Punjab National Bank was set up in 1895 and is a Government of India undertaking and provides banking and other financial services primarily to retail and corporate clients in India. Punjab National Bank (PNB) is the third largest bank in India in terms of asset size and is currently the second largest state-owned commercial bank in India.
For FY 2014, PNB’s net interest margins stood at 3.44 % (3.52 % for FY 2013). Total deposits with the bank stood at Rs. 4,51,397 Cr. growing by 15.30 % over the previous year. For the same period, net NPA’s stood at 2.85% (2.35% for FY 2013).
As of March 31, 2014, PNB’s customer base was over 82 million and its distribution network was at 6,200 branches and 6,940 ATMs. Bank has overseas footprints in 10 countries with 4 overseas branches and an offshore banking unit in Mumbai; wholly owned subsidiary in UK with 7 branches; a subsidiary each in Kazakhstan & Bhutan; 5 Representative offices in Australia, Norway, Dubai, China and Kazakhstan; and 1 joint venture with Everest Bank Ltd., Nepal.
Punjab National Bank - STOCK INFORMATION
|
STOCK PRICE |
1121.00 |
|
TARGET PRICE |
1160-1200 |
|
SECTOR |
BANK |
|
SYMBOL (AT NSE) |
PNB |
|
ISIN |
INE160A01014 |
|
FACE VALUE (IN RS.) |
10.00 |
|
BSE CODE |
532461 |
Punjab National Bank - STOCK FUNDAMENTALS
|
MARKET CAP |
40,588.04 |
|
BOOK VALUE |
991.39 |
|
EPS - (TTM) (IN RS. CR.) |
97.83 |
|
P/E |
11.46 |
|
INDUSTRY P/E |
12.55 |
INVESTMENT RATIONALE
PNB’s Q2FY15 PAT at Rs 5.8bn came in sharply below estimates due to a 24bps decline in NIMs, higher staff expenses and provisions, but partly supported by greater other income. Asset quality deteriorated significantly with slippages/ restructuring remaining high at Rs 39.7bn/Rs 32.9bn (5.1%/ 4.2%). While the bank’s performance remains volatile, we are positive on the stock given a decent CETI of 8.4%, a healthy domestic CASA ratio of 40%, and reasonable valuations of 1.0x FY16E ABV "With a calibrated approach to growth, PNB is well-placed among PSU banks to benefit from an economic recovery, which in turn should translate into lower credit costs for the bank. We remain positive on the stock given Punjab National Bank (PNB’s) comfortable capital position, a healthy domestic CASA ratio, and reasonable valuations.
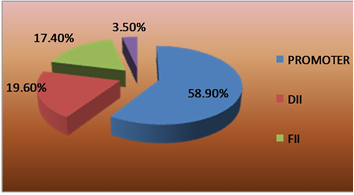
SHAREHOLDING PATTERN
OUTLOOK AND VALUATION
Net stress additions increased significantly QoQ. However, loan portfolio is highly levered to resolution of policy bottlenecks and improvement in economic growth. We have cut the PAT estimates by 20%+ to factor higher credit costs and weak margins. Despite factoring a high credit cost of 1.6% and 36% tax rate, FY15E PAT is expected to grow 27% YoY. Focus on profitable growth, healthy core NIM, CET1 of ~8.4% are certain positives for PNB. Maintain Buy.
RESULTS (Quarterly )(Rs CR.)
|
|
SEP' 14 |
JUN' 14 |
MAR' 14 |
DEC' 13 |
SEP' 13 |
|
Sales |
11,462.09 |
11,588.69 |
11,101.33 |
10,983.87 |
10,733.51 |
|
Operat- ing profit |
6,860.62 |
8,170.24 |
6,737.37 |
6,936.66 |
6,454.75 |
|
Interest |
7,310.89 |
7,208.99 |
7,099.53 |
6,762.75 |
6,717.97 |
|
Gross profit |
2,876.03 |
3,125.30 |
3,173.43 |
2,702.38 |
2,534.84 |
|
EPS (Rs) |
15.89 |
38.81 |
22.27 |
20.86 |
14.30 |
Punjab National Bank - TECHNICAL VIEW
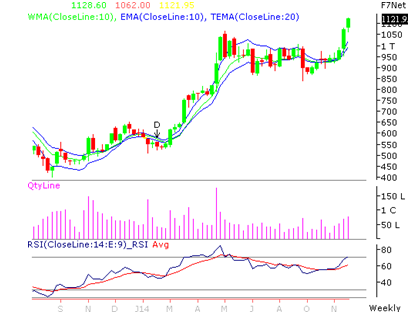
Punjab National Bank (PNB) is looking strong on charts. We advise to buy around 1100-1125 with stoploss of 1060 for the targets of 1160-1200 levels. RSI is also showing upside momentum in it
|
SYMBOL |
VALUE |
ACTION |
|
RSI(14) |
65.445 |
BUY |
|
STOCH(9,6) |
69.874 |
BUY |
|
STOCHRSI(14) |
84.491 |
OVERBOUGHT |
|
MACD(12,26) |
-31.090 |
SELL |
|
ADX(14) |
24.654 |
BUY |
|
WILLIAMS %R |
-14.007 |
OVERBOUGHT |
|
CCI(14) |
119.0442 |
BUY |
|
ATR(14) |
8.4143 |
LESS VOLATILITY |
|
HIGH/LOWS(14) |
15.6071 |
BUY |
|
ULTIMATE OSCILLATOR |
58.606 |
BUY |
|
ROC |
3.553 |
BUY |
|
BULL/BEAR POWER()13 |
22.7060 |
BUY |
|
BUY: 08 SELL:1 NEUTRAL: 2 |
SUMMARY : STRONG BUY |
|
Our Other Recommendation for Next Week
|
SCRIP |
ACTION |
CMP |
ENTRY |
SL |
TGT |
TIME FRAME |
|
ITC |
BUY |
391.35 |
388-392 |
383 |
398-408 |
ONE WEEK |
|
AMBUJA CEM |
BUY |
236.95 |
232-236 |
227 |
242-248 |
ONE WEEK |
|
DLF |
BUY |
161.70 |
160-162 |
156 |
166-170 |
ONE WEEK |
|
RELCAP |
SELL |
518.90 |
520-525 |
540 |
510-490 |
ONE WEEK |
|
RADICO KHITAN |
BUY |
99.00 |
97-100 |
92 |
105-110 |
ONE WEEK |
Performance of Previous Week
|
SCRIP |
LOT |
ACTION |
ENTRY |
SL |
TGT |
P&L |
REMARK |
CLOSE / LOW/HIGH |
|
BPCL |
500 |
BUY |
750-760 |
730 |
775-785 |
-10000.00 |
SL TRG |
714.90 / 764.75 |
|
IDEA |
2000 |
SELL |
160-162 |
165 |
155-150 |
10000.00 |
FIRST TGT HIT |
153.80 / 152.25 |
|
PFC |
1000 |
BUY |
308-312 |
302 |
318-324 |
-6000.00 |
SL TRG |
306.00 / 297.60 |
|
BANK OF INDIA |
1000 |
BUY |
285-290 |
278 |
296-304 |
19000.00 |
BOTH TGT HIT |
300.65 / 307.40 |
|
UCO BANK |
4000 |
BUY |
87-89 |
85 |
92-95 |
16000.00 |
NEAR TGT |
88.60 / 91.10 |
|
BANK BARODA |
250 |
BUY |
1080-1100 |
1060 |
1120-1140 |
10000.00 |
FIRST TGT HIT |
1113.30 / 1128.50 |
|
NET PROFIT |
|
|
|
|
|
39000.00 |
|
|
- Share :


Post a Comment
|
DISCLAIMER |
This report is only for the information of our customers. Recommendations, opinions, or suggestions are given with the understanding that readers acting on this information assume all risks involved. The information provided herein is not to be construed as an offer to buy or sell securities of any kind. ATS and/or its group companies do not as assume any responsibility or liability resulting from the use of such information.