RALLIS INDIA LTD
KEY INFORMATION FOR RALLIS INDIA LIMITED
|
Date |
19 November 2020 |
|
Market Price (INR) |
255.4 |
|
52Week H/L |
340.0/127.1 |
|
Market Cap (INR Mn) |
49,685 |
|
Shares Outstanding (Mn) |
194.5 |
|
Industry |
Agrochemical |
|
Recommendation |
Buy |
|
Target Price |
346.8 |
|
Upside/Downside |
35.8% |
|
Key Financial |
FY20 |
FY21E |
FY22E |
FY23E |
|
Sales |
22,518 |
25,496 |
29,368 |
33,946 |
|
Growth (%) |
13.5% |
13.2% |
15.2% |
15.6% |
|
EBITDA |
2,937 |
3,437 |
4,586 |
5,549 |
|
Margin (%) |
13.0% |
13.5% |
15.6% |
16.3% |
|
PAT |
1,837 |
2,132 |
2,970 |
3,688 |
|
EPS |
9.5 |
11.0 |
15.3 |
19.0 |
|
Growth (%) |
19.0% |
15.3% |
39.3% |
24.2% |
|
DPS |
2.5 |
2.7 |
3.8 |
4.7 |
|
ROE (%) |
13.0% |
13.6% |
16.6% |
17.8% |
|
ROCE (%) |
15.8% |
17.3% |
21.1% |
22.7% |
|
EV/EBITDA(x) |
16.7x |
14.3x |
10.7x |
8.8x |
|
P/E(x) |
26.2x |
22.7x |
16.3x |
13.1x |
|
Share Holding Pattern (%) |
|
|
Promoter |
50.1% |
|
FIIs |
6.6% |
|
DIIs |
17.5% |
|
Others |
25.9% |
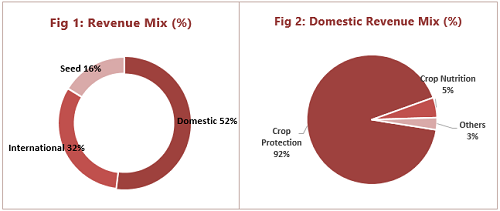
Redefined strategy drive the domestic business’s growth
Domestic market contributes slightly over 50% of overall revenues. The new management redefined the strategy to revive the domestic growth by strengthening their product portfolio by adding new products, expanding the distribution reach, and enriching their brand image. Rallis introduced 6 new products and added 145 new dealers on the board. The contribution of new products has improved due to strong response from the market.
With the growing opportunities in export, international business a key driver
The international business contributes over 30% to overall revenues. The company is working to build an institutional partnership for active ingredients and contract manufacturing. They are increasing their capacity for developing new molecules and current products to meet the demand of existing and potential new clients. Management is also looking for registration in the overseas market, which can boost exports and improve margins.
Diversified seed business
Seed business contributes 16% to the overall business, with the majority of revenue coming from the Kharif portfolio. The company is working on the non-Kharif crops to diversify the business. A diversified seed business will not reduce seasonality in revenue and provide operating leverage benefits, which will gradually improve margin.
Available at an attractive valuation
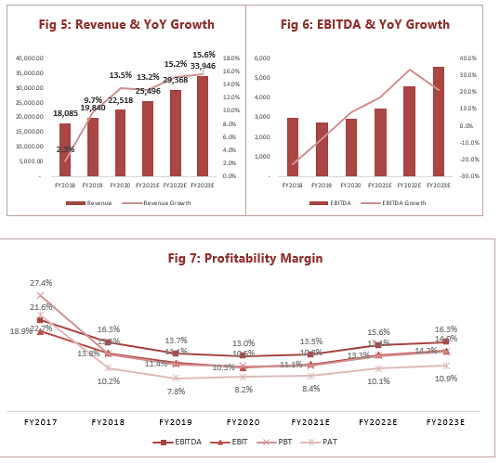
We estimate revenue CAGR of 14.6%, EBITDA CAGR of ~24%, and EPS CAGR of 26% over the FY20-23E. The stock currently trades at 16X of FY22E EPS, which we believe is available at an attractive valuation.
Rallis India Limited - Company Profile
Rallis India Limited is a subsidiary of Tata Chemicals Limited and a part of the Tata Group. It is an agrochemical company with more than 160 years of experience of servicing rural markets with a comprehensive portfolio of products for Indian farmers. It manufactures and markets a complete portfolio of Pesticides, Seeds, and Plant growth nutrients for Indian farmers. It also partners with global agrochemical players by offering crop protection chemicals as well as contract manufacturing services. Its key strengths include its sustained relationship with farmers, a wide distribution network, branding & marketing expertise, and its strong product portfolio.
It has four manufacturing facilities located at Ankleshwar, Dahej, Lote, and Akola. It has also set up the Rallis Innovation Chemistry Hub (RICH), an R&D facility for organic synthesis and formulation development in Bengaluru, which contributes significantly to all the business divisions. The R&D lab of the Seeds division, also located in Bengaluru, is undertaking cutting-edge technology development in the Agri-Biotech arena.
Rallis India Ltd Management Profile
|
Name |
Designation |
|
Sanjiv Lal |
CEO, Director & MD |
|
S. Nagarajan |
Chief Operating Officer |
|
Ashish Mehta |
Chief Financial Officer |
|
S. Mallikarjunappa, PhD |
Vice President-Research & Development |
|
Yashaswin Sheth |
Secretary & Compliance Officer |
|
Siddheswar Mallick |
Vice President-Marketing |
|
Sukhbir Singh Malik |
Vice President-Domestic Sales |
RALLIS INDIA LTD BOARD MEMBERS
|
Name |
Designation |
Details |
|
Bhaskar Bhat |
Chairman |
Currently, Mr. Bhat holds the position of Managing Director & Executive Director at Titan Co. Ltd. In the past Mr. Bhat held the position of Chairman of Tata Ceramics Ltd. and Associate of Infomedia India Ltd. Mr. Bhat received an undergraduate degree from Indian Institute of Technology Madras.
|
|
Sanjiv Lal |
CEO, Director & MD |
Sanjiv Lal is Chief Executive Officer, Director & MD at Rallis India Ltd. In the past he occupied the position of Joint Managing Director at Indo Maroc Phosphore SA and Chief Operating Officer-India Chemicals Operations at Tata Chemicals Ltd. He received an undergraduate degree from Indian Institute of Technology Delhi.
|
|
Padmini Khare Kaicker, CPA |
Independent Non-Executive Director |
Padmini Khare Kaicker is on the board of Tata Chemicals Ltd. and 4 other companies. In the past she was Managing Partner at B.K. Khare & Co. |
|
Collur Visweswaria Natraj, PhD |
Independent Non-Executive Director |
Collur Visweswaria Natraj is on the board of Tata Chemicals Ltd. and Rallis India Ltd. He received a doctorate from Indian Institute of Science.
|
|
Punita Kumar-Sinha, PhD, CFA |
Independent Non-Executive Director |
Founder of Pacific Paradigm Advisors LLC, Punita Kumar- Sinha is Member of The Boston Security Analysts Society, Inc., Managing Partner at Pacific Paradigm Advisors LLC and Member of Council on Foreign Relations, Inc. and on the board of 13 other companies. She received an undergraduate degree from Indian Institute of Technology New Delhi, an MBA from Drexel University and a doctorate and a graduate degree from The Wharton School of the University of Pennsylvania.
|
|
Source: Marketscreener, virtualglobetrotting, ATS Research |
||
New Product Launches and Expansion in Distribution Network Drive the Domestic Business Growth
Rallis’ domestic crop care business contributes 52% to overall revenues in FY20 and mainly comprises of crop protection and crop nutrients segment. Crop protection is a major revenue contributor for the domestic market and provides a range of insecticides, fungicides, and herbicides suitable for the Indian crop’s requirements. Domestic business grew by 14.4% in FY20 and ~8% in Q2FY21. Company has a market share of 6% in the crop care segment
New Management Redefined Strategy to Revive the Domestic Business
Rallis India Limited, a TATA Enterprise changed their top management in January 2019. The new management building their legacy and strength and has redefined their strategy to ‘Reposition Rallis for Leadership’. The company aims to be among the top three leading agrichemical player by 2025. The company’s management to revive the domestic business’s growth is looking for focus on developing novel formulation, enhancing their wide product portfolio, and expanding & strengthening their distribution network.
Extensive product portfolio with newly added products
The domestic crop protection has wide range of 50+ products and provides across all key crops with prominence in paddy, cotton, and vegetables. Tie ups with several global players to market their products in India, which can leverage the company for introducing new product molecules in the domestic market. Company launched six new products (3 in-house and rest co-marketing) in FY20. These include Zygant, Ayaan, and Sarthak, which were registered under the 9(3) categories while Cameo, Trimbo, and Impeder were co-marketing products.
Company received a good response from Zygant, Ayaan, and Sarthak, which can help them to improve the market share. During the FY20 the Innovator Turnover Index (ITI) increased to 16% from 10% in FY19 due to good market response to the newly added product in the last few years. The ITI is the company’s internal benchmark which represents revenue performance for new products introduced during the previous 4 years.
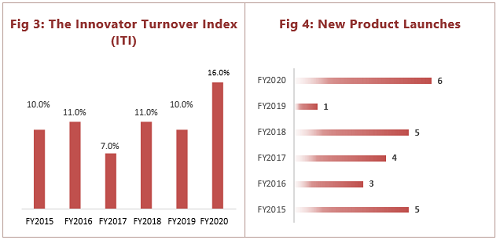
Rallis has a strong pipeline of new products for the next three to five years and plans to launch at least two new products every year and leverage its own in-house R&D. The new product introductions in the domestic market led to higher revenue growth and market share gains.
Achieve deeper market through the strong distribution network
Rallis had 3,812 distributors and 47,377+ retailers on their network and added 145 distributors and 7000 retailers to their network. The several key initiatives to strengthen its distribution network by the company to achieve growth.
They have eased the trade terms, restructured dealer’s incentives, and streamlined the internal process and policies to support the growth.
After the softened growth over the last 5 years, we expect that the domestic business’s revenues will grow at 16.3% CAGR for FY20-23E on the back of an extensive range of products by newly added molecules and a large & strong distribution network.
International Business Drive the Growth through growing opportunities in Export market and Capacity Expansion
The international business contributes 32% of total revenues in FY20. The segment comprises two sub-segments of active ingredients exports and contract manufacturing, which contribute 75% and 25% to the segment revenues. The company considers this segment as a key business to de-risk the monsoon-dependent domestic business. They are increasing their capacity for current and new active ingredients to meet existing and new clients’ demands. Rallis manufactures active ingredients for international business, and it is dependent on five key ingredients Metribuzin, Pendimethalin, Hexaconazole, Acephate, and Metalaxyl. The company witnessed strong growth in these products due to the tighter supply from China, increased demand in markets such as Latin America, and could be driving the growth of the international business.
|
Key active ingredients manufactured by RALIS for B2B exports |
||
|
Products |
Global Market Size (USD MN) |
Description |
|
Pendimethalin |
413 |
Used as a pre-emergence herbicide to control annual grasses and certain broadleaf weeds. |
|
Acephate |
510 |
An organophosphate foliar and soil insecticide used primarily for control of aphids, leaf miners, caterpillars, sawflies, thrips, and spider mites. |
|
Hexaconazole |
149 |
It is a broad-spectrum systemic triazole fungicide used for the control of many fungi used chiefly for the control of rice sheath blight in China, India, Vietnam and parts of East Asia. |
|
Metribuzin |
196 |
It is a herbicide used both pre- and post-emergence in crops including soybean, potatoes, tomatoes and sugarcane. |
|
Metalaxyl |
89 |
It is an acylalanine fungicide used to control Pythium in several vegetable crops, and Phytophthora in peas. |
|
Source: Company Data, ATS Research |
||
Capacity Expansion and Creation of INR 8 bn
The management indicated that the CAPEX of INR 8 bn of capacity expansion in the next 5 years. From INR 8 bn, the management indicated to have a line of apex worth of INR 5.3 bn. The new projects are likely to commercialize 1) a formulation in Dahej byQ4FY21, 2) a new R&D facility, 3) a facility for multiple product lines by Q3FY22, and 4) Investment in AI, pilot plant, automation, etc. The management guided that is also looking at intermediates for investment.
The international business de-grew by ~18% YoY in the first half of the FY21 mainly due to softened demand in North America and a 50% decline in Metribuzin’s realization because of the oversupply. Going forward, we expect the price to stabilize and move up as demand is back in the system; the capacity expansion and growth opportunities will drive the growth. We expect revenues of international business to grow at ~15% CAGR for FY20-23E.
Merger with Metahelix drives the Seeds Business and helps in Diversification and Margin Expansion
Rallis acquired a majority stake in Metahelix Life Science Limited in 2016 and completed the merger of Metahelix in January 2020. The merger would help Rallis in streamlining the operation. Seed business contributes 16% to overall revenues in FY20 and 85% of revenue contributes from only Kharif crops. They have a strong presence in Kharif Market, especially in hybrid paddy, maize, and millet, leading to seasonality in revenue and impacting the overall margin. Working on Rabi crops, fruits and vegetables, hybrid maize, and building their presence reduces the seasonality in revenue and provides operating leverage benefits. Rallis’ cotton pipeline is shaping up strongly. We expect that seed business will grow at a 9.2 % CAGR for FY20-23E.
Strong Earnings Growth led the Improved Return Ration
We expect EBITDA to grow at a ~24% CAGR due to higher revenue growth, healthy domestic demand, better export market opportunities, and diversified seed business. The EBITDA margin expands 330 bps from 13% in FY20 to 16.3% in FY23E on the back of improvements in operating margins over FY20-23%.
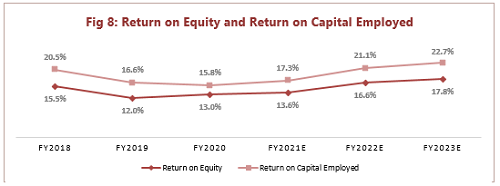
The return of equity (RoE) declined from 20% prior to FY15 to low teens of 12% & 13% in FY19 and FY20 mainly due to weak performance in the domestic market and margin compression. We expect improvement in profitability, which would lead to improvement in RoE from 13% in FY20 to 18% in FY23E.
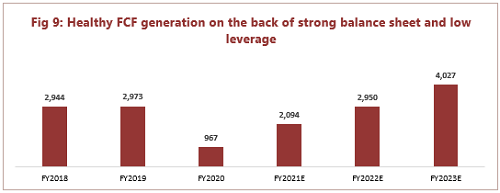
Strong Earnings Growth led the Improved Return Ration
The planned Capex of INR 8 bn for the next five years for increased capabilities for the Formulation, Active Ingredients, and backward integration enables Rallis to mitigate growing demand, improve the cost efficiency, and reduce the import dependency with a strong balance sheet and low debt. We believe that the company would generate higher free cash flow comfortably.
Rallis India Limited - Outlook and Valuation
We expect domestic market share gains, growth in export opportunities and a diversified seed portfolio would boost the profitability for Rallis over the next three year and anticipate revenue CAGR of 14.6% over FY20-23E. EBITDA is expected to grow at ~24% CAGR for FY20-23E led by 330 bps margin expansion. ROE should improve from 13% to 18% over FY20-23E. EPS will grow at 26% at CAGR FY20-23E. We value Rallis India limited through discounted cash flow method using WACC of 13.4 % gives a target price of INR 347, upside of 35.8% with a BUY recommendation.
The stock is currently trading at 16.3x FY22E EPS, which we believe is attractive. We value the stock at 21x FY22E EPS of INR 15.3 and arrive at a target price of INR 321 per share that gives ~29% upside.
|
DCF Valuation |
|||||||||||||
|
|
FY2020 |
FY2021E |
FY2022E |
FY2023E |
FY2024E |
FY2025E |
FY2026E |
FY2027E |
FY2028E |
FY2029E |
FY2030E |
FY2031E |
|
|
Sales |
22,518 |
25,496 |
29,368 |
33,946 |
38,359 |
43,346 |
48,547 |
54,373 |
59,810 |
65,791 |
72,370 |
78,160 |
|
|
Sales Yoy |
13.5% |
13.2% |
15.2% |
15.6% |
13.0% |
13.0% |
12.0% |
12.0% |
10.0% |
10.0% |
10.0% |
8.0% |
|
|
EBIT |
2,322 |
2,825 |
3,910 |
4,836 |
5,446 |
6,132 |
6,843 |
7,637 |
8,371 |
9,175 |
10,057 |
10,861 |
|
|
EBIT M |
10.3% |
11.1% |
13.3% |
14.2% |
14.2% |
14.1% |
14.1% |
14.0% |
14.0% |
13.9% |
13.9% |
13.9% |
|
|
Tax Rate |
22.7% |
22.7% |
22.7% |
22.7% |
22.7% |
22.7% |
22.7% |
22.7% |
22.7% |
22.7% |
22.7% |
22.7% |
|
|
NOPAT |
1,796 |
2,185 |
3,024 |
3,740 |
4,212 |
4,743 |
5,293 |
5,907 |
6,475 |
7,097 |
7,778 |
8,401 |
|
|
Nopat M |
8.0% |
8.6% |
10.3% |
11.0% |
11.0% |
10.9% |
10.9% |
10.9% |
10.8% |
10.8% |
10.7% |
10.7% |
|
|
D&A |
615 |
612 |
675 |
713 |
806 |
910 |
1,019 |
1,142 |
1,256 |
1,382 |
1,520 |
1,641 |
|
|
D&A % Sales |
2.7% |
2.4% |
2.3% |
2.1% |
2.1% |
2.1% |
2.1% |
2.1% |
2.1% |
2.1% |
2.1% |
2.1% |
|
|
|
|
||||||||||||
|
Capex |
786 |
1,530 |
1,468 |
1,290 |
997 |
997 |
1,019 |
1,033 |
1,017 |
1,053 |
1,086 |
1,172 |
|
|
As % of Sales |
3.5% |
6.0% |
5.0% |
3.8% |
2.6% |
2.3% |
2.1% |
1.9% |
1.7% |
1.6% |
1.5% |
1.5% |
|
|
Chg in WC |
658 |
-827 |
-719 |
-863 |
-899 |
-907 |
-895 |
-866 |
-803 |
-719 |
-796 |
-860 |
|
|
As % of Sales |
2.9% |
-3.2% |
-2.4% |
-2.5% |
-2.3% |
-2.1% |
-1.8% |
-1.6% |
-1.3% |
-1.1% |
-1.1% |
-1.1% |
|
|
|
|
||||||||||||
|
FCFF |
967 |
2,094 |
2,950 |
4,027 |
4,919 |
5,563 |
6,188 |
6,882 |
7,517 |
8,145 |
9,009 |
9,729 |
|
Rallis India Limited - Key Financials
|
Income statement |
FY2019 |
FY2020 |
FY2021E |
FY2022E |
FY2023E |
|
Revenue |
19,840 |
22,518 |
25,496 |
29,368 |
33,946 |
|
Other Income |
307 |
343 |
378 |
415 |
457 |
|
Total Income |
20,146 |
22,861 |
25,874 |
29,784 |
34,403 |
|
COGS |
11,715 |
13,900 |
15,553 |
17,474 |
20,062 |
|
Gross Profit |
8,431 |
8,962 |
10,321 |
12,310 |
14,341 |
|
Excise Duty on Goods |
- |
- |
- |
- |
- |
|
Employee Benefits |
1,806 |
2,001 |
2,167 |
2,467 |
2,851 |
|
Other Expenses |
3,909 |
4,024 |
4,717 |
5,257 |
5,941 |
|
EBITDA |
2,716 |
2,937 |
3,437 |
4,586 |
5,549 |
|
D/A |
461 |
615 |
612 |
675 |
713 |
|
EBIT |
2,255 |
2,322 |
2,825 |
3,910 |
4,836 |
|
Finance Cost |
52 |
61 |
69 |
70 |
68 |
|
PBT before Exceptional Items |
2,203 |
2,261 |
2,756 |
3,840 |
4,768 |
|
Exceptional Items |
- |
114 |
- |
- |
- |
|
PBT |
2,203 |
2,375 |
2,756 |
3,840 |
4,768 |
|
Tax Expense |
655 |
538 |
624 |
870 |
1,080 |
|
PAT |
1,548 |
1,837 |
2,132 |
2,970 |
3,688 |
|
Balance sheet |
FY2019 |
FY2020 |
FY2021E |
FY2022E |
FY2023E |
|
PPE |
3,698 |
3,608 |
4,526 |
5,319 |
5,896 |
|
CWIP |
129 |
288 |
288 |
288 |
288 |
|
Right of Use Assets |
- |
264 |
264 |
264 |
264 |
|
Investment Property |
55 |
1 |
1 |
1 |
1 |
|
Goodwill |
1,958 |
1,958 |
1,958 |
1,958 |
1,958 |
|
Other Intangibles |
97 |
97 |
97 |
97 |
97 |
|
Intangible assets under development |
378 |
469 |
469 |
469 |
469 |
|
Investment |
38 |
38 |
38 |
38 |
38 |
|
Loans |
67 |
91 |
91 |
91 |
91 |
|
Other Financial Assets |
4 |
8 |
8 |
8 |
8 |
|
Income Tax Assets |
752 |
1,100 |
1,100 |
1,100 |
1,100 |
|
Deferred Tax Assets |
217 |
- |
- |
- |
- |
|
Other Non-Current Assets |
318 |
421 |
421 |
421 |
421 |
|
Total Non-Current Assets |
7,711 |
8,342 |
9,260 |
10,053 |
10,630 |
|
CCE |
418 |
465 |
318 |
1,035 |
2,358 |
|
Bank balance other than CCE |
39 |
21 |
21 |
21 |
21 |
|
Inventories |
6,736 |
6,992 |
7,499 |
8,330 |
9,454 |
|
Investments |
1,055 |
2,987 |
2,987 |
2,987 |
2,987 |
|
Loans |
9 |
- |
- |
- |
- |
|
Other Financial Assets |
46 |
65 |
65 |
65 |
65 |
|
Trade Receivables |
4,491 |
4,506 |
5,099 |
5,713 |
6,324 |
|
Other Current Assets |
1,338 |
1,064 |
1,064 |
1,064 |
1,064 |
|
Assets Classified as held for Sale |
- |
43 |
43 |
43 |
43 |
|
Total Current Assets |
14,132 |
16,142 |
17,096 |
19,257 |
22,315 |
|
Total Assets |
21,843 |
24,485 |
26,356 |
29,310 |
32,946 |
|
Borrowings |
158 |
124 |
124 |
124 |
124 |
|
Lease Liabilities |
- |
144 |
144 |
144 |
144 |
|
Other Financial Liabilities |
64 |
64 |
64 |
64 |
64 |
|
Provision |
219 |
256 |
256 |
256 |
256 |
|
Deff. Tax Liabilities |
382 |
285 |
285 |
285 |
285 |
|
Other Non-Current Liabilities |
1 |
1 |
1 |
1 |
1 |
|
Total Non-Current Liabilities |
824 |
874 |
874 |
874 |
874 |
|
Borrowings |
530 |
496 |
496 |
496 |
496 |
|
Tarde Payables |
5,348 |
6,373 |
6,647 |
7,373 |
8,245 |
|
Other Financial Liabilities |
1,068 |
893 |
893 |
893 |
893 |
|
Lease Liabilities |
- |
139 |
139 |
139 |
139 |
|
Other Current Liabilities |
991 |
1,200 |
1,200 |
1,200 |
1,200 |
|
Provision |
162 |
171 |
171 |
171 |
171 |
|
Income Tax Liabilities |
43 |
236 |
236 |
236 |
236 |
|
Total Current Liabilities |
8,142 |
9,509 |
9,783 |
10,508 |
11,380 |
|
Total Liabilities |
8,966 |
10,383 |
10,657 |
11,383 |
12,255 |
|
Share Capital |
194 |
194 |
194 |
194 |
194 |
|
Retained Earnings |
9,082 |
10,318 |
11,916 |
14,144 |
16,910 |
|
Other Equity |
3,583 |
3,582 |
3,582 |
3,582 |
3,582 |
|
Non-Controlling Interest |
18 |
7 |
7 |
7 |
7 |
|
Total Equity |
12,878 |
14,101 |
15,700 |
17,928 |
20,693 |
|
Total Equity & Liabilities |
21,843 |
24,485 |
26,357 |
29,310 |
32,948 |
|
Cash Flow |
FY2019 |
FY2020 |
FY2021E |
FY2022E |
FY2023E |
|
PBT |
2,203 |
2,375 |
2,756 |
3,840 |
4,768 |
|
Finance Cost |
52 |
61 |
69 |
70 |
68 |
|
D/A |
461 |
615 |
612 |
675 |
713 |
|
Other Funds |
26 |
-88 |
-70 |
-70 |
-70 |
|
Operating PBT before WC Chg. |
2,742 |
2,964 |
3,367 |
4,516 |
5,479 |
|
(+)/- in Trade Receivables |
-586 |
-83 |
-593 |
-614 |
-611 |
|
(+)/- in Inventories |
-1,014 |
-235 |
-507 |
-831 |
-1,124 |
|
(+)/- in Trade Payables |
207 |
976 |
274 |
726 |
872 |
|
Cash Generated From Operation |
1,510 |
3,932 |
2,540 |
3,797 |
4,616 |
|
Income Tax Paid (Net of Refunds) |
-709 |
-564 |
-624 |
-870 |
-1,080 |
|
Net CFO |
801 |
3,368 |
1,916 |
2,927 |
3,535 |
|
Capex |
-465 |
-786 |
-1,530 |
-1,468 |
-1,290 |
|
Proceeds from disposal of PPE & Inv Prop |
3 |
130 |
- |
- |
- |
|
Acquisition of Subsidiaries |
- |
- |
- |
- |
- |
|
Net Cash flow from Investing |
-514 |
-2,459 |
-1,530 |
-1,468 |
-1,290 |
|
Proceeds from Lon-term borrowings |
- |
- |
- |
- |
- |
|
Repayment of Long term borrowing |
-45 |
-40 |
- |
- |
- |
|
Proceeds from short-term borrowings |
1,070 |
2,890 |
- |
- |
- |
|
Repayment of short-term borrowings |
-900 |
-2,805 |
- |
- |
- |
|
Dividend Paid |
-585 |
-587 |
-533 |
-742 |
-922 |
|
Net Cash Flow from Financing |
-515 |
-744 |
-533 |
-742 |
-922 |
|
Ratio |
FY2019 |
FY2020 |
FY2021 |
FY2022 |
FY2023 |
|
EPS |
7.99 |
9.51 |
10.96 |
15.27 |
18.96 |
|
Growth Ratio |
|||||
|
Sales Growth |
9.7% |
13.5% |
13.2% |
15.2% |
15.6% |
|
EBITDA Growth |
-8.0% |
8.1% |
17.0% |
33.4% |
21.0% |
|
EPS Growth |
-7.3% |
19.0% |
15.3% |
39.3% |
24.2% |
|
Profitability Margin |
|||||
|
Gross Profit Margin |
42.5% |
39.8% |
40.5% |
41.9% |
42.2% |
|
EBITDA Margin |
13.7% |
13.0% |
13.5% |
15.6% |
16.3% |
|
EBIT Margin |
11.4% |
10.3% |
11.1% |
13.3% |
14.2% |
|
Net Profit Margin |
7.8% |
8.2% |
8.4% |
10.1% |
10.9% |
|
Return Ration |
|||||
|
RoE |
12.0% |
13.0% |
13.6% |
16.6% |
17.8% |
|
RoCE |
16.6% |
15.8% |
17.3% |
21.1% |
22.7% |
|
Inventory Days |
194 |
180 |
176 |
174 |
172 |
|
Receivables Days |
78 |
73 |
73 |
71 |
68 |
|
Payables Days |
165 |
154 |
156 |
154 |
150 |
|
Cash Conversion Cycle |
107 |
99 |
93 |
91 |
90 |
Rallis India Limited - Stock Performance
- Share :


Post a Comment
|
DISCLAIMER |
This report is only for the information of our customers. Recommendations, opinions, or suggestions are given with the understanding that readers acting on this information assume all risks involved. The information provided herein is not to be construed as an offer to buy or sell securities of any kind. ATS and/or its group companies do not as assume any responsibility or liability resulting from the use of such information.