Rashtriya Chemicals and Fertilizers Ltd.
|
Current price |
65.40 |
|
Sector |
Fertilizers |
|
No of shares |
551688100 |
|
52 week high |
74.75 |
|
52 week low |
33.80 |
|
BSE Sensex |
27886.21 |
|
Nifty |
8448.10 |
|
Average Volume |
557,213 |
|
BSE Code |
524230 |
|
NSE Symbol |
RCF |
Rashtriya Chemicals and Fertilizers Ltd - Company Overview
Rashtriya Chemicals and Fertilizers Ltd (RCF) is a leading fertilizer and chemical manufacturing company in India in the Public Sector. It was established on 6th March, 1978 on the reorganization of erstwhile Fertilizer Corporation of India Ltd. into five new companies viz. Fertilizer Corporation of India (FCI), Hindustan Fertilizer Corporation Limited (HFC), Projects & Development India Limited (PDIL), National Fertilizers Limited (NFL) and Rashtriya Chemicals & Fertilizers Limited (RCF).
Rashtriya Chemicals and Fertilizers Ltd operates two units viz. one at Trombay (Mumbai) and the other one at Thal, Raigad district, about 100 KM from Mumbai. Company has portfolio of products which includes Urea, Complex Fertilizers and Industrial Chemicals. The Ujjwala Urea and Complex fertilizer Suphala brands of fertilizers manufactured by RCF carry high brand equity and are recognized brands all over the country. These products are taken to the farthest corner of the country by extensive RCF dealers network spread throughout the country.
Rashtriya Chemicals and Fertilizers Ltd (RCF) also produces bio-fertilizers, micronutrients and 100% water soluble fertilizers. Apart from these products, RCF produces 20 industrial chemicals such as Methanol, Ammonium bicarbonate, Methyl Amine, Formic Acid, Dimethyl Formamide etc. which find elaborate applications in many industries like dyes, solvents, leather, pharmaceuticals and a host of other industries.
Rashtriya Chemicals and Fertilizers Ltd (RCF) always strives for upkeep of the plants through modernizing and upgrading technology. Revamping and de-bottlenecking is the secret that has kept the company thriving for four and a half decades. As part of modernization, Rashtriya Chemicals and Fertilizers Ltd (RCF) has modernized its Ammonia – I, Nitric Acid, Methanol and ANP plants at its Trombay unit. This has facilitated plants to sustain operations and meet technological challenges of improved efficiency, lower energy consumption and maintain environmental norms. It has also resulted in company achieving the highest standards of safety and product quality. Company has also completed another ambitious project viz. Ammonia revamp at Thal unit which enabled company to produce an additional 3.0 Lakh MT of Urea and save precious foreign exchange. The current market capitalisation stands at Rs 3,657.69 crore.
Rashtriya Chemicals and Fertilizers Ltd - Share Holding Pattern
|
Category |
No. of Shares |
Percentage |
|
Promoters |
441,353,888 |
80.00 |
|
General Public |
42,488,257 |
7.70 |
|
Financial Institutions |
38,077,431 |
6.90 |
|
Foreign Institutions |
16,046,886 |
2.91 |
|
Other Companies |
8,081,789 |
1.46 |
|
Foreign - Others |
3,226,477 |
0.58 |
|
Others |
1,390,514 |
0.25 |
|
Foreign - NRI |
848,750 |
0.15 |
|
NBFC and Mutual Funds |
172,868 |
0.03 |
|
Foreign - OCB |
900 |
0.00 |
|
Foreign Industries |
340 |
0.00 |
Rashtriya Chemicals and Fertilizers Ltd - Financial Details
-
Market Cap (Rs Cr) – 3591.49
-
Company P/E (x) – 8.80
-
Industry P/E (x) – 10.78
-
Book Value (Rs) – 45.47
-
Price / BV (x) – 1.43
-
Dividend (%) – 15 %
-
EPS (TTM) – 7.40
-
Dividend Yield (%) – 2.30 %
-
Face Value (Rs) – 10
Industry Overview
India fertilizer industry is one industry with immense scopes in the future. India is primarily agriculture oriented country and its economy is highly dependent on the agrarian produce. The majority of the populace of India lives in rural areas and the foremost occupation in the villages is agriculture. Developments pertaining to different industries are being made on a massive scale to change the country's economy from an agrarian one to a industrial one. It is extremely important for the fertilizer industry India to have development in terms of technologically advance manufacturing process and innovative new-age products.
Fertilizers play an important role in increasing efficiency of agricultural output. With the strengthening of pricing control policies and reforms, the fertilizers market is expected to be regulated soon in India. Fertilizer products are based on chemicals such as Nitrogen, Potassium and Phosphorus, where nitrogen based fertilizers have the largest usage in India. India is the second largest consumer of fertilizers in the World, after China. It accounted for 15.3 per cent of the World’s consumption of nitrogenous (N), 19 per cent of phosphatic (P) and 14.4 per cent of potassic (K) nutrients in 2008 (FAI, 2010). Indian agricultural fertilizers market is anticipated to be growing at the CAGR of around 7% during 2012-17. Indian fertilizers market structure constitute of public as well as private companies, manufacturing wide range of phosphatic and nitrogenous based fertilizers.
Fertilizer management is mostly influenced by two sets of policies: fertilizer subsidies and nutrient management policies. In a five-year perspective, changes to fertilizer subsidy schemes can be anticipated in India to rebalance fertilization; As monsoons picked up pace during Q2 FY15, the sales volumes are estimated to have picked up during Q2 FY15. However, gas availability and prices continue to remain a concern for the industry. The comprehensive fertilizer policy is also expected to usher in long-term and long-awaited reforms for the fertilizer industry, largely related to improvement in soil health and optimization of nutrient consumption, apart from ensuring long-term food security of the country by trying up the long-term supply of fertilizers and raw materials.
Balance Sheet
|
|
Mar '14 |
Mar '13 |
Mar '12 |
Mar '11 |
Mar '10 |
|
Sources Of Funds |
|
|
|
|
|
|
Total Share Capital |
551.69 |
551.69 |
551.69 |
551.69 |
551.69 |
|
Equity Share Capital |
551.69 |
551.69 |
551.69 |
551.69 |
551.69 |
|
Reserves |
1,956.70 |
1,803.60 |
1,619.51 |
1,460.04 |
1,285.45 |
|
Networth |
2,508.39 |
2,355.29 |
2,171.20 |
2,011.73 |
1,837.14 |
|
Secured Loans |
1,128.68 |
1,037.87 |
294.33 |
351.71 |
258.10 |
|
Unsecured Loans |
538.41 |
635.34 |
890.88 |
129.91 |
1,072.74 |
|
Total Debt |
1,667.09 |
1,673.21 |
1,185.21 |
481.62 |
1,330.84 |
|
Total Liabilities |
4,175.48 |
4,028.50 |
3,356.41 |
2,493.35 |
3,167.98 |
|
Application Of Funds |
|
|
|
|
|
|
Gross Block |
3,999.29 |
3,675.82 |
3,483.97 |
3,245.25 |
3,110.69 |
|
Less: Accum. Depreciation |
2,379.62 |
2,259.11 |
2,086.82 |
1,962.82 |
1,867.98 |
|
Net Block |
1,619.67 |
1,416.71 |
1,397.15 |
1,282.43 |
1,242.71 |
|
Capital Work in Progress |
77.19 |
184.25 |
177.31 |
90.84 |
140.05 |
|
Investments |
17.86 |
18.04 |
18.04 |
15.32 |
15.30 |
|
Inventories |
802.54 |
1,205.06 |
1,177.71 |
534.75 |
409.59 |
|
Sundry Debtors |
2,769.09 |
2,579.21 |
1,978.24 |
891.17 |
858.98 |
|
Cash and Bank Balance |
70.95 |
175.74 |
592.28 |
99.14 |
84.54 |
|
Total Current Assets |
3,642.58 |
3,960.01 |
3,748.23 |
1,525.06 |
1,353.11 |
|
Loans and Advances |
257.55 |
245.34 |
277.65 |
574.91 |
1,482.97 |
|
Fixed Deposits |
0.00 |
0.00 |
0.00 |
320.11 |
700.11 |
|
Total CA, Loans & Advances |
3,900.13 |
4,205.35 |
4,025.88 |
2,420.08 |
3,536.19 |
|
Current Liabilities |
1,136.56 |
1,500.53 |
1,971.70 |
1,072.16 |
1,543.43 |
|
Provisions |
302.81 |
295.32 |
290.27 |
243.16 |
222.84 |
|
Total CL & Provisions |
1,439.37 |
1,795.85 |
2,261.97 |
1,315.32 |
1,766.27 |
|
Net Current Assets |
2,460.76 |
2,409.50 |
1,763.91 |
1,104.76 |
1,769.92 |
|
Miscellaneous Expenses |
0.00 |
0.00 |
0.00 |
0.00 |
0.00 |
|
Total Assets |
4,175.48 |
4,028.50 |
3,356.41 |
2,493.35 |
3,167.98 |
|
Contingent Liabilities |
438.78 |
548.26 |
634.93 |
407.19 |
125.23 |
|
Book Value (Rs) |
45.47 |
42.69 |
39.36 |
36.46 |
33.30 |
Profit and Loss Account
|
|
Mar '14 |
Mar '13 |
Mar '12 |
Mar '11 |
Mar '10 |
|
Income |
|
|
|
|
|
|
Sales Turnover |
6,587.60 |
6,894.49 |
6,433.71 |
5,591.42 |
5,711.91 |
|
Excise Duty |
0.00 |
0.00 |
0.00 |
69.20 |
55.25 |
|
Net Sales |
6,587.60 |
6,894.49 |
6,433.71 |
5,522.22 |
5,656.66 |
|
Other Income |
74.04 |
92.99 |
166.72 |
156.50 |
168.08 |
|
Stock Adjustments |
-309.61 |
7.02 |
459.21 |
-19.50 |
-92.43 |
|
Total Income |
6,352.03 |
6,994.50 |
7,059.64 |
5,659.22 |
5,732.31 |
|
Expenditure |
|
|
|
|
|
|
Raw Materials |
2,979.83 |
3,536.95 |
4,112.22 |
3,039.29 |
3,558.53 |
|
Power & Fuel Cost |
1,318.92 |
1,180.19 |
970.57 |
871.85 |
575.42 |
|
Employee Cost |
442.00 |
449.40 |
402.00 |
377.35 |
358.03 |
|
Other Manufacturing Expenses |
0.00 |
0.00 |
0.00 |
63.15 |
55.65 |
|
Selling and Admin Expenses |
0.00 |
0.00 |
0.00 |
650.59 |
619.41 |
|
Miscellaneous Expenses |
970.92 |
1,186.44 |
1,008.62 |
127.79 |
74.04 |
|
Total Expenses |
5,711.67 |
6,352.98 |
6,493.41 |
5,130.02 |
5,241.08 |
|
Operating Profit |
566.32 |
548.53 |
399.51 |
372.70 |
323.15 |
|
PBDIT |
640.36 |
641.52 |
566.23 |
529.20 |
491.23 |
|
Interest |
131.29 |
88.25 |
49.33 |
66.14 |
73.05 |
|
PBDT |
509.07 |
553.27 |
516.90 |
463.06 |
418.18 |
|
Depreciation |
141.75 |
173.15 |
142.44 |
112.62 |
105.56 |
|
Profit Before Tax |
367.32 |
380.12 |
374.46 |
350.44 |
312.62 |
|
Extra-ordinary items |
0.00 |
0.00 |
0.00 |
9.34 |
8.22 |
|
PBT (Post Extra-ord Items) |
367.32 |
380.12 |
374.46 |
359.78 |
320.84 |
|
Tax |
117.43 |
99.22 |
125.22 |
114.27 |
111.73 |
|
Reported Net Profit |
249.89 |
280.90 |
249.24 |
245.12 |
234.87 |
|
Total Value Addition |
2,731.84 |
2,816.03 |
2,381.19 |
2,090.73 |
1,682.55 |
|
Equity Dividend |
82.75 |
82.75 |
77.24 |
60.69 |
60.69 |
|
Corporate Dividend Tax |
14.04 |
14.06 |
12.53 |
9.84 |
10.08 |
|
Per share data (annualised) |
|
|
|
|
|
|
Shares in issue (lakhs) |
5,516.88 |
5,516.88 |
5,516.88 |
5,516.88 |
5,516.88 |
|
Earning Per Share (Rs) |
4.53 |
5.09 |
4.52 |
4.44 |
4.26 |
|
Equity Dividend (%) |
15.00 |
15.00 |
14.00 |
11.00 |
11.00 |
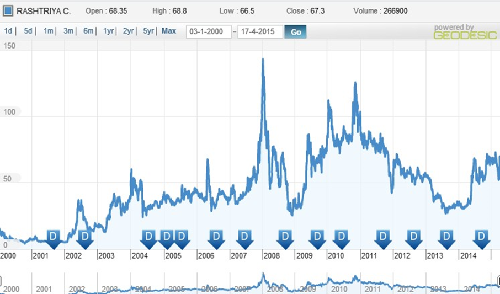
Dividend History
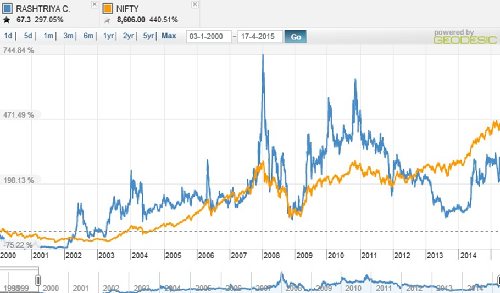
Index and Company Price Movement Comparison
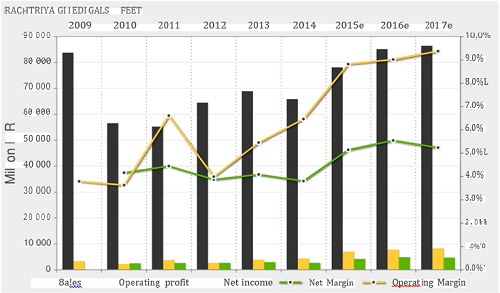
Company Forecast
Technical Indicators
|
Name |
Value |
Action |
|
RSI(14) |
69.846 |
Buy |
|
STOCH(9,6) |
78.071 |
Buy |
|
STOCHRSI(14) |
67.695 |
Buy |
|
MACD(12,26) |
116.560 |
Buy |
|
ADX(14) |
50.696 |
Buy |
|
Williams %R |
-17.756 |
Overbought |
|
CCI(14) |
111.9634 |
Buy |
|
ATR(14) |
103.6714 |
High Volatility |
|
Highs/Lows(14) |
115.3500 |
Buy |
|
Ultimate Oscillator |
68.670 |
Buy |
|
ROC |
162.699 |
Buy |
|
Bull/Bear Power(13) |
286.8980 |
Buy |
Important Ratios (YoY)
-
PBIT – 6.37 v/s 5.37
-
RoCE – 11.94 v/s 11.62
-
RoE – 10.04 v/s 9.32
-
Net Profit Margin – 3.75 v/s 4.02
-
Return on net worth – 9.96 v/s 11.62
-
D/E Ratio – 0.66 v/s 0.71
-
Interest Cover – 4.88 v/s 7.27
-
Current Ratio – 1.09 v/s 1.03
-
Reserves – 1956.70 cr v/s 1803.60 cr
-
PAT – 249.89 cr v/s 280.90 cr
-
Total assets – 4175.48 cr v/s 4028.50 cr
-
Net sales – 6587.60 cr v/s 6894.49 cr
-
Book Value – 45.47 v/s 42.69
Simple Moving Average
|
Days |
BSE |
NSE |
|
30 |
60.92 |
60.96 |
|
50 |
63.63 |
63.65 |
|
150 |
62.83 |
62.83 |
|
200 |
61.45 |
61.45 |
Investment Rationalize
-
Rashtriya Chemicals and Fertilizers Ltd (RCF), a Government of India Undertaking is a leading fertilizer and chemical manufacturing company with about 80% of its equity held by the Government of India with a market capitalization of Rs.3591 crore.
-
Chemicals essential for every industry from food and drugs to Synthetic fibres, from textiles and cement to pesticides and paints; from explosives to specialty solvents and dye stock are produced by RCF, which helps the company to tap the demand of the products in each and every industry.
-
Company have a well established chain of dealers and corporative marketing societies in order to sell the products all over the country.
-
Improvement in technology used in manufacturing and increase in production capacity will help the company in order to face the challenges in the market in terms of efficiency, production capacity and reduction in manufacturing cost.
-
MoU and Joint Ventures with industrial majors such as GAIL, Coal India and FACT will add to the profitability and efficiency of the company.
-
Governments policy towards agriculture, its efforts towards modernizing public limited companies and “Make in India” campaign will act as a major trigger towards the next big movement.
-
Price to Sales Ratio of the company stands at 0.55, which means company is reasonably priced, and the past consistent performance and future growth prospects ensures the company is reasonably priced.
- Share :


Post a Comment
|
DISCLAIMER |
This report is only for the information of our customers. Recommendations, opinions, or suggestions are given with the understanding that readers acting on this information assume all risks involved. The information provided herein is not to be construed as an offer to buy or sell securities of any kind. ATS and/or its group companies do not as assume any responsibility or liability resulting from the use of such information.