SINTEX INDUSTRIES LTD
Sintex Industries Ltd - Company Details
The Sintex group is one of the leading providers of plastics and niche textile-related products in India. With global footprints spanning 9 countries, Sintex Industries has a strong presence in the European, American, African, and Asian markets including countries like France, Germany and USA.
Established in India in 1931, Sintex Industries has a proven track record of pioneering innovative concepts in plastics and textile sectors in India and an uninterrupted 82 years of dividend payment to its shareholders.
Sintex Industries Ltd is organized into two business segments namely, textile and plastics. In the textile division, Sintex Industries manufactures high-value, yarn-dyed structured fabrics, corduroy and items relating to home textiles. In the plastic division, Sintex Industries manufactures the following: storage solutions for water, oil and fuel; prefabricated structures, monolithic structures, industrial custom moulded products, consumer custom moulded products and interiors products. Sintex Industries Ltd is having eight manufacturing facilities located at Kalol, Kolkata, Daman, Bangalore, Nagpur, Baddi, Salem and Bhachau in India. The company is headquartered in Kalol in Gujarat with 13 branch offices across India.
Sintex Industries has reported a consolidated sales of Rs 1,826.03 crore and a Net Profit of Rs 161.09 crore for the quarter ended Dec 2014.
Sintex Industries Ltd - Company DetailsShare Holding Pattern
|
Category |
No. of Shares |
Percentage |
|
Promoters |
304,514,362 |
31.35 |
|
Financial Institutions |
213,958,910 |
22.03 |
|
General Public |
207,600,159 |
21.38 |
|
Foreign Institutions |
168,689,185 |
17.37 |
|
NBFC and Mutual Funds |
32,769,719 |
3.37 |
|
Other Companies |
26,808,106 |
2.76 |
|
Central Government |
121,659 |
0.01 |
|
Foreign – OCB |
5,625 |
0.00 |
Sintex Industries Ltd - Company DetailsFinancial Details
-
Market Cap (Rs Cr) – 4123.76
-
Company P/E – 9.15
-
Industry P/E – 17.05
-
Book Value (Rs) – 77.67
-
Dividend (%) – 70%
-
EPS (TTM) – 11.58
-
Dividend Yield (%) – 0.66%
-
Face Value (Rs) -1
Industry Details
Ever since 1957, the Plastics Industry in India has made significant achievements as it made a modest but promising beginning by commencing production of Polystyrene. The Phenomenal developments in the plastic machinery sector is coupled with the developments in the petrochemical sector, both of which support the plastic processing sector. Plastic material is gaining notable importance in different spheres of activity and the per capita consumption is increasing at a fast pace. Continuous advancements and developments in Plastic technology, processing machineries, expertise, and cost effective manufacturing is fast replacing the typical materials. On the basis of value added share, the Indian Plastic industry is about 0.5% of India's GDP. The export of plastic products also yields about 1% of the country's exports. The sector has a large presence of small scale companies in the industry, which account for more than 50% turnover of the industry and provides employment to an estimated 0.4 million people in the country. Approximately Rs.100 billion are invested in the form of fixed assets in the plastic processing industry.
Typically, in an emerging market, demand growth for plastics is 2 to 2.5 times the GDP growth. Sadly this is not the case in India where the growth at times has been lower than the GDP growth. The per capita consumption of plastics in India at 5kg is much lower than that of China which averages 25kg. But India could see very soon improvement in the production of Plastic. India today represents range of highly promising opportunities for growth of plastics producers worldwide. The fragmented plastics industry in India is beginning to consolidate, governmental regulations and trade barriers are coming down due to India's recent admission to the WTO, and some large North American plastics manufacturers have already begun doing business here. The Indian Plastic industry is at the verge of high growth rate over about 10%-12% which is contributed by high growth rates, in turn, from the end-user industries. This trend has mainly been driving the automotive sector, since the economy is already showing signs of recovery from the downturn. As the Plastic industry is heavily dependent on reals estate, packaging and automotive sector, launching of new cars in the small segments are expected to drive the demand for plastics.
Sintex Industries Ltd - Company DetailsBalance Sheet
|
|
Mar '14 |
Mar '13 |
Mar '12 |
Mar '11 |
Mar '10 |
|
Sources Of Funds |
|
|
|
|
|
|
Total Share Capital |
31.12 |
31.12 |
27.11 |
27.11 |
27.10 |
|
Equity Share Capital |
31.12 |
31.12 |
27.11 |
27.11 |
27.10 |
|
Share Application Money |
28.31 |
28.31 |
0.00 |
0.00 |
0.00 |
|
Reserves |
2,982.70 |
2,739.91 |
2,306.76 |
2,145.31 |
1,855.02 |
|
Networth |
3,042.13 |
2,799.34 |
2,333.87 |
2,172.42 |
1,882.12 |
|
Secured Loans |
2,373.84 |
1,612.21 |
1,415.42 |
1,391.35 |
1,058.72 |
|
Unsecured Loans |
1,032.17 |
972.69 |
1,251.02 |
1,104.63 |
1,115.65 |
|
Total Debt |
3,406.01 |
2,584.90 |
2,666.44 |
2,495.98 |
2,174.37 |
|
Total Liabilities |
6,448.14 |
5,384.24 |
5,000.31 |
4,668.40 |
4,056.49 |
|
Application Of Funds |
|
|
|
|
|
|
Gross Block |
3,474.21 |
2,800.71 |
2,584.09 |
2,313.28 |
1,773.64 |
|
Less: Accum. Depreciation |
808.72 |
693.67 |
574.02 |
524.73 |
437.05 |
|
Net Block |
2,665.49 |
2,107.04 |
2,010.07 |
1,788.55 |
1,336.59 |
|
Capital Work in Progress |
84.50 |
207.13 |
75.81 |
121.06 |
136.75 |
|
Investments |
1,029.24 |
966.55 |
874.23 |
1,123.64 |
807.94 |
|
Inventories |
168.28 |
200.97 |
175.77 |
174.69 |
168.70 |
|
Sundry Debtors |
1,299.64 |
1,236.63 |
1,146.07 |
838.12 |
677.06 |
|
Cash and Bank Balance |
102.70 |
355.19 |
605.63 |
45.73 |
77.36 |
|
Total Current Assets |
1,570.62 |
1,792.79 |
1,927.47 |
1,058.54 |
923.12 |
|
Loans and Advances |
2,031.73 |
1,085.21 |
1,022.11 |
530.34 |
794.13 |
|
Fixed Deposits |
0.00 |
0.00 |
0.00 |
854.71 |
737.68 |
|
Total CA, Loans & Advances |
3,602.35 |
2,878.00 |
2,949.58 |
2,443.59 |
2,454.93 |
|
Current Liabilities |
890.18 |
732.44 |
612.35 |
510.90 |
385.65 |
|
Provisions |
43.26 |
42.04 |
297.03 |
297.54 |
294.07 |
|
Total CL & Provisions |
933.44 |
774.48 |
909.38 |
808.44 |
679.72 |
|
Net Current Assets |
2,668.91 |
2,103.52 |
2,040.20 |
1,635.15 |
1,775.21 |
|
Total Assets |
6,448.14 |
5,384.24 |
5,000.31 |
4,668.40 |
4,056.49 |
|
Contingent Liabilities |
1,606.71 |
173.59 |
88.99 |
59.94 |
216.93 |
|
Book Value (Rs) |
96.25 |
88.50 |
85.49 |
79.58 |
137.89 |
Sintex Industries Ltd - Company DetailsProfit and Loss Account
|
|
Mar '14 |
Mar '13 |
Mar '12 |
Mar '11 |
Mar '10 |
|
Income |
|
|
|
|
|
|
Sales Turnover |
3,233.12 |
2,969.26 |
2,562.59 |
2,718.74 |
2,103.56 |
|
Excise Duty |
0.00 |
0.00 |
0.00 |
102.88 |
93.05 |
|
Net Sales |
3,233.12 |
2,969.26 |
2,562.59 |
2,615.86 |
2,010.51 |
|
Other Income |
97.81 |
-34.54 |
14.91 |
60.01 |
96.86 |
|
Stock Adjustments |
-23.37 |
28.85 |
4.32 |
-5.36 |
-13.97 |
|
Total Income |
3,307.56 |
2,963.57 |
2,581.82 |
2,670.51 |
2,093.40 |
|
Expenditure |
|
|
|
|
|
|
Raw Materials |
2,188.14 |
2,096.10 |
1,763.35 |
1,764.22 |
1,371.44 |
|
Power & Fuel Cost |
74.96 |
93.82 |
87.27 |
68.18 |
59.86 |
|
Employee Cost |
112.99 |
106.40 |
94.46 |
85.62 |
74.97 |
|
Selling and Admin Expenses |
0.00 |
0.00 |
0.00 |
55.12 |
54.08 |
|
Miscellaneous Expenses |
117.76 |
113.53 |
104.71 |
42.52 |
54.34 |
|
Preoperative Exp Capitalised |
0.00 |
0.00 |
0.00 |
0.00 |
0.00 |
|
Total Expenses |
2,493.85 |
2,409.85 |
2,049.79 |
2,015.75 |
1,616.45 |
|
Operating Profit |
715.90 |
588.26 |
517.12 |
594.75 |
380.09 |
|
PBDIT |
813.71 |
553.72 |
532.03 |
654.76 |
476.95 |
|
Interest |
237.38 |
118.09 |
110.49 |
86.82 |
51.32 |
|
PBDT |
576.33 |
435.63 |
421.54 |
567.94 |
425.63 |
|
Depreciation |
138.33 |
123.18 |
98.05 |
89.25 |
84.03 |
|
Profit Before Tax |
438.00 |
312.45 |
323.49 |
478.69 |
341.43 |
|
PBT (Post Extra-ord Items) |
438.00 |
312.45 |
323.49 |
471.63 |
334.67 |
|
Tax |
102.94 |
43.26 |
93.79 |
114.07 |
60.97 |
|
Reported Net Profit |
335.06 |
269.19 |
229.70 |
357.56 |
273.70 |
|
Total Value Addition |
305.71 |
313.75 |
286.44 |
251.53 |
245.01 |
|
Equity Dividend |
21.92 |
21.92 |
17.74 |
17.74 |
16.38 |
|
Corporate Dividend Tax |
3.72 |
3.56 |
2.88 |
2.84 |
2.67 |
|
Per share data (annualised) |
|
|
|
|
|
|
Shares in issue (lakhs) |
3,131.10 |
3,131.10 |
2,729.91 |
2,729.91 |
1,364.95 |
|
Earning Per Share (Rs) |
10.70 |
8.60 |
8.41 |
13.10 |
20.05 |
|
Equity Dividend (%) |
70.00 |
70.00 |
65.00 |
65.00 |
60.00 |
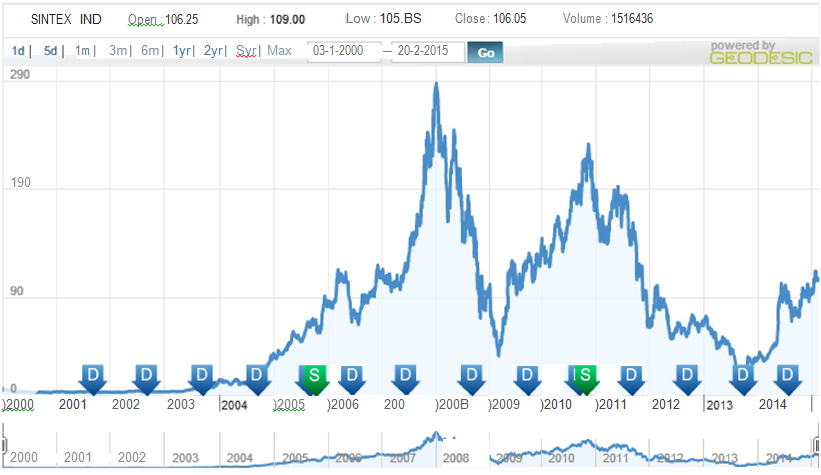
Dividend History
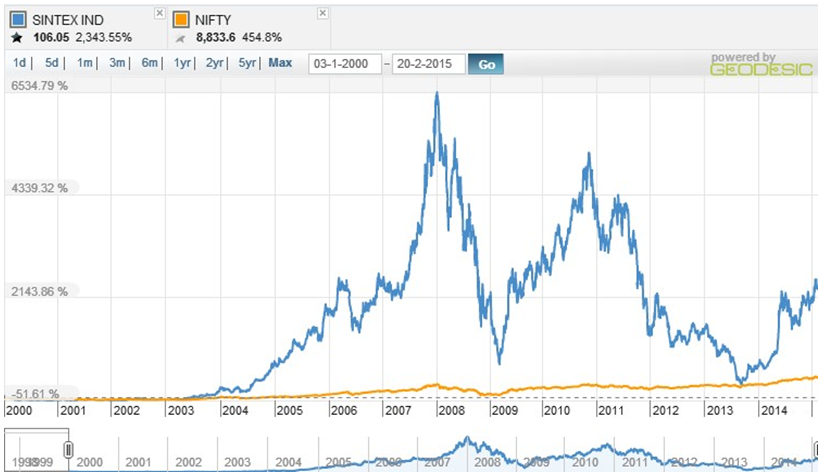
Index and Company Price Movement Comparison
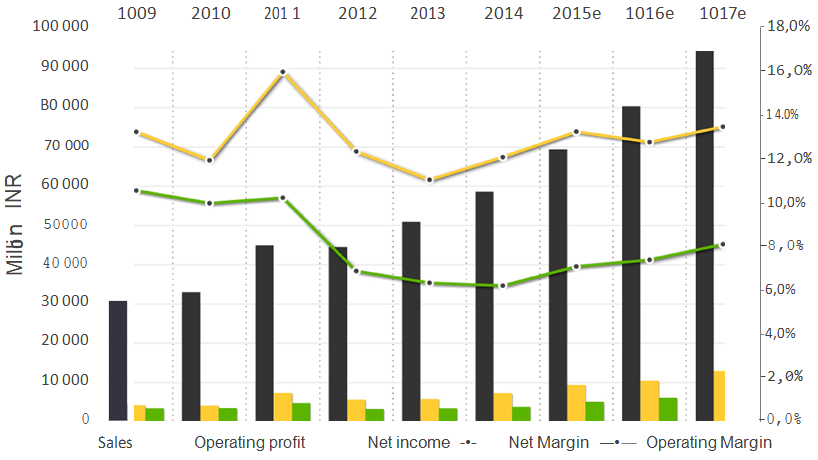
Company Forecast
Technical Indicators
|
Symbol |
Value |
Action |
|
RSI(14) |
62.213 |
Buy |
|
STOCH(9,6) |
69.965 |
Buy |
|
STOCHRSI(14) |
89.825 |
Overbought |
|
MACD(12,26) |
7.000 |
Buy |
|
ADX(14) |
44.590 |
Buy |
|
Williams %R |
-16.134 |
Overbought |
|
CCI(14) |
108.9592 |
Buy |
|
ATR(14) |
18.8429 |
High Volatility |
|
Highs/Lows(14) |
20.8893 |
Buy |
|
Ultimate Oscillator |
54.622 |
Buy |
|
ROC |
210.132 |
Buy |
|
Bull/Bear Power(13) |
54.9540 |
Buy |
Important Ratios
-
PBIT – 17.25 v/s 15.37
-
RoCE – 10.72 v/s 9.67
-
RoE – 11.76 v/s 10.67
-
Net Profit Margin – 10.01 v/s 8.89
-
Return on net worth – 11.11 v/s 9.71
-
D/E Ratio – 1.13 v/s 0.93
-
Interest Cover – 2.91 v/s 4.41
-
Current Ratio – 1.96 v/s 1.83
-
Reserves – 2982.70 cr v/s 2739.91 cr
-
PAT – 335.06 cr v/s 269.19 cr
-
Total assets – 6448.14 cr v/s 5384.24 cr
-
Net sales – 3233.12 cr v/s 2969.26 cr
-
Book Value – 96.25 v/s 88.50
Simple Moving Average
|
Days |
BSE |
NSE |
|
30 |
105.33 |
105.42 |
|
50 |
100.82 |
100.85 |
|
150 |
90.20 |
90.20 |
|
200 |
88.20 |
88.22 |
Recommendations
Buy Sintex Industries Ltd. at current or lower market levels
Reasons for the recommendations are :
-
Sound financial position of the company.
-
Availability of adequate manufacturing facility to meet demands.
-
Capex is not required in near term.
-
Releasing of pending funds by government and its efforts on small housing schemes will increase cash flow and revenue.
-
Huge difference in per capita expenditure on plastic by Indian population when compared with rest of the world.
-
Growth forecast of real estate, automobile and textile industry will add to the growth of the company.
-
Well diversified product mix will help to tap the product mix.
-
Improved QoQ performance of sales
- Share :


Post a Comment
|
DISCLAIMER |
This report is only for the information of our customers. Recommendations, opinions, or suggestions are given with the understanding that readers acting on this information assume all risks involved. The information provided herein is not to be construed as an offer to buy or sell securities of any kind. ATS and/or its group companies do not as assume any responsibility or liability resulting from the use of such information.