Solara Active Pharma Sciences Limited
|
Industry |
Market Price |
Recommendation |
Target |
Time Horizon |
|
Pharmaceuticals |
1045 |
Buy |
1620 |
1 Year |
Solara Active Pharma Sciences Limited - Q3 FY21 Review
Solara Active Pharma Sciences Limited reported a net turnover of Rs 405.1 crore for the quarter ended Sept 30, 2021, when compared to Rs 403.2 crore for the quarter ended Sept 30, 2020. Profit Before Tax and Profit After Tax was Rs 30.2 crore and Rs 30.2 crore for the quarter ended Sept 30, 2021, as compared to Rs 55.9 crore and Rs 55.9 crore during the corresponding quarter of the previous year.
Solara Active Pharma Sciences Limited - Investment Summary
|
CMP (Rs) |
|
|
52 Week H/L |
1859/980 |
|
Market Cap (Cr) |
3,749 |
|
Face Value (Rs) |
10.00 |
|
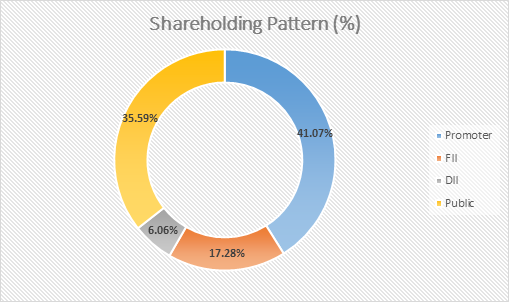
Promoter Holding (%) |
41.07 |
|
Non-Promoter Holding (%) |
58.93 |
|
Total (%) |
100.00 |
Overview
-
2nd largest player in Indian API/CRAMS market
-
Cost leader in Ibuprofen API
-
Strong presence in regulated markets
-
The company aims a revenue CAGR of 25% over FY21-25
-
Strong tailwinds supporting the industry- China Plus One strategy
-
Merger with Aurore, Empyrean Lifesciences and Hydra Active Pharma
Solara Active Pharma Sciences Limited - Quarterly Summary
|
Quarterly |
Sep-2021 |
Jun-2021 |
Mar-2021 |
Dec-2020 |
Sep-2020 |
|
|
401 |
405 |
444 |
426 |
397 |
|
Other Income |
3 |
5 |
9 |
8 |
6 |
|
Total Income |
404 |
411 |
454 |
434 |
403 |
|
Total Expenditure |
358 |
342 |
372 |
348 |
327 |
|
EBIT |
46 |
69 |
81 |
86 |
76 |
|
Interest |
17 |
18 |
24 |
20 |
19 |
|
Tax |
0 |
0 |
0 |
0 |
0 |
|
Net Profit |
29 |
50 |
56 |
65 |
56 |
Business
Solara Active Pharma Sciences Limited is an emerging player in pure Active Pharma Ingredients (API) and Contract Research and Manufacturing Services (CRAMS). The merger of API businesses of Strides Shasun Ltd. and Sequent Scientific Ltd. brought Solara into existence in FY18. 30 years of presence in the industry, 2 R&D Centers, 6 manufacturing sites, and 25 successful USFDA Audits across different sites make Solara one of the strongest players in the industry. The Company has a diversified product portfolio and a strong presence across developed and emerging markets.
Solara mainly operates in two business segments - API and CRAMS. The company realizes around 90% of the revenue from the API segment and 10% of the revenue from the CRAMS segment. The API segment offers its products in the product categories of Commercial and R&D Pipeline. In the commercial category, the company has 36 products whereas, in the R&D Pipeline, it has 17 products. Solara offers the highest number of products in the therapeutic category of anti-inflammatory (9). The other therapeutic categories in which Solara has a strong presence are anesthetics, anthelmintic, anti-hypertensive, anticonvulsant, cardiovascular agents. The company has around 25 APIs in the development stage across high-value product segments. In FY21, Solara launched 2 new products across geographies, filed 8 US Drug Master Files (DMFs) and 3 EU DMFs. Solara has customers in 75+ countries.
The company provides differentiated services for APIs including contract development and manufacturing (CDM), analytical services, and impurity synthesis. The company has CDM capabilities along the entire value chain of a new chemical entity. Solara provides value along with the development of products, from the pre-clinical phase to the commercial phase. The company is associated with all-size pharma companies across North America, Europe, ROW, and Japan. Solara acts as a one-stop solution provider to its customers because of its track record in process development with superior quality systems and global accreditations for GMP manufacturing.
The company’s merger with Aurore Life Science, Empyrean life sciences, and Hydro Active Pharma Sciences made Solara the second-largest pure API player in India. The combined entities will complement each other in the areas of product portfolio, geographical presence, and customers. Aurore’s 20 filed DMFs in the US would further bolster Solara’s presence in the US market. Aurore realizes around 29% of its revenue from the APAC region. This merger transaction will make Solara one of the largest API suppliers in the APAC region. Solara’s CRAMS segment benefits from the addition of Aurore’s CRAMS portfolio. The combined entity would have 8 manufacturing sites, 3 R&D centers, 100+ commercial products, and 110+ DMFs.
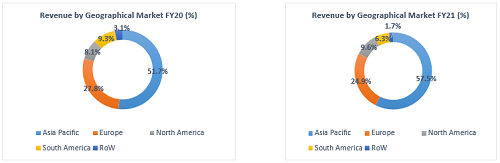
Revenue Trend
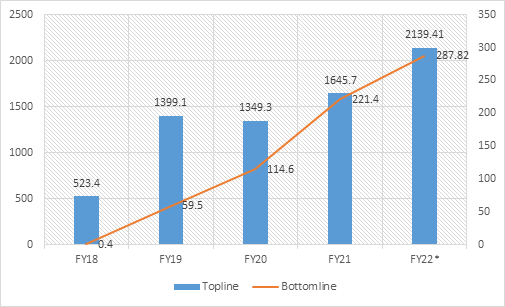
Topline and Bottomline trend (Crores)
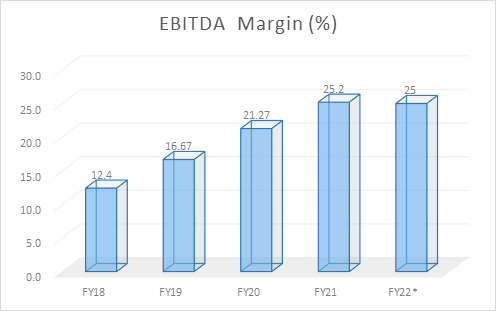
EBITDA Margin Trend (%)
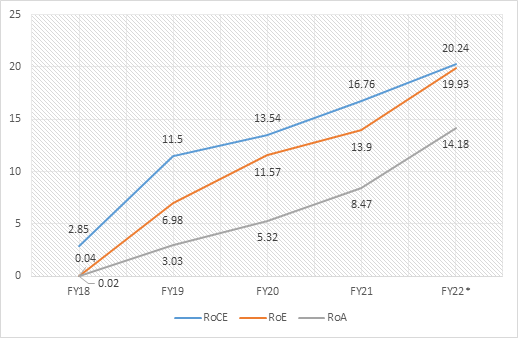
ROE, ROCE, and Asset Turnover trend (%)
Shareholding Pattern (%)
Top 10 Shareholders
|
Rank |
Name |
Holdings % |
|
1 |
Overseas Corporate Bodies |
11.51 |
|
2 |
TPG Growth IV SF PTE. LTD. |
11.50 |
|
3 |
ArunKumar Pillai |
8.82 |
|
4 |
Karuna Business Solutions LLP |
7.83 |
|
5 |
Pronomz Ventures LLP |
5.90 |
|
6 |
Bodies Corporate |
5.75 |
|
7 |
SRJR Enterprise LLP |
4.73 |
|
8 |
K R Ravishankar |
3.69 |
|
9 |
TIMF Holdings |
3 |
|
10 |
HUF |
2.81 |
Ratio Analysis
|
Year-end March |
FY18 |
FY19 |
FY20 |
FY21 |
|
Per-share data (Rs) |
|
|
|
|
|
Basic EPS |
0.3 |
21.7 |
42.8 |
64.5 |
|
Diluted EPS |
0.3 |
21.7 |
42.8 |
64.5 |
|
Cash EPS |
13.9 |
55.3 |
77.7 |
91.9 |
|
BV/Share |
311.4 |
332.2 |
370.3 |
443.4 |
|
P/E |
- |
19.28 |
10.38 |
21.6 |
|
Dividend/share |
0 |
5 |
2 |
7 |
|
Net Profit/share |
0.8 |
24.1 |
41.9 |
61.5 |
|
Profitability Ratios (%) |
|
|
|
|
|
EBDIT Margin (%) |
12.72% |
16.95% |
21.05% |
25.15% |
|
EBIT Margin (%) |
6.27% |
11.27% |
14.4% |
18.89% |
|
PBT Margin (%) |
1.45% |
5.24% |
8.51% |
13.66% |
|
Net Profit Margin (%) |
0.37% |
4.53% |
8.51% |
13.66% |
|
Return on Assets (%) |
0.1% |
3.2% |
5.22% |
8.46% |
|
Total Debt/Equity (X) |
0.7 |
0.5 |
0.6 |
0.3 |
|
Asset Turnover Ratio (%) |
28.66% |
70.66% |
61.43% |
61.94% |
|
Liquidity Ratios (%) |
|
|
|
|
|
Current Ratio (X) |
0.8 |
1 |
0.9 |
1.3 |
|
Quick Ratio (X) |
0.6 |
0.7 |
0.5 |
1 |
|
Inventory Turnover Ratio (X) |
2.8 |
6.8 |
4.7 |
5.5 |
|
Dividend Payout Ratio NP (%) |
0 |
0 |
13.92% |
8.93% |
|
Dividend Payout Ratio CP (%) |
0 |
0 |
7.59% |
5.99% |
|
Earnings Retention Ratio (%) |
0 |
0 |
86.08% |
91.07% |
|
Cash Earnings Retention Ratio (%) |
0 |
0 |
92.41% |
94.01% |
|
Valuation Ratios (X) |
|
|
|
|
|
Enterprise Value (Cr.) |
0 |
1445.7 |
1719.8 |
5325.5 |
|
Market Cap/Sales (X) |
0 |
0.8 |
0.9 |
3.1 |
|
Price/BV (X) |
- |
1.3 |
1.2 |
3.3 |
Financial Overview
Profit and Loss Statement (crore)
|
Year-end March |
FY18 |
FY19 |
FY20 |
FY21 |
|
INCOME (Cr.) |
|
|
|
|
|
Revenue From Operations [Gross] |
501.5 |
1322.1 |
1267.6 |
1575.7 |
|
Less: Excise/Service Tax/Other Levies |
0 |
0 |
0 |
0 |
|
Revenue From Operations [Net] |
501.5 |
1322.1 |
1267.6 |
1575.7 |
|
Total Operating Revenues |
521 |
1386.7 |
1321.8 |
1616.9 |
|
Other Income |
2.5 |
12.4 |
27.5 |
28.8 |
|
Total Revenue |
523.4 |
1399.1 |
1349.3 |
1645.7 |
|
EXPENSES |
|
|
|
|
|
Cost Of Materials Consumed |
270.2 |
729.5 |
623.4 |
683.8 |
|
Purchase Of Stock-In Trade |
4.1 |
9.1 |
29.7 |
42.8 |
|
Changes In Inventories Of FG,WIP And Stock-In Trade |
-2.5 |
-33.8 |
-54.2 |
-2.1 |
|
Employee Expenses |
68.5 |
185.8 |
204.1 |
229.4 |
|
Depreciation And Amortization Expenses |
34 |
83.1 |
94.2 |
108.7 |
|
Other Expenses |
118.1 |
275.2 |
259.3 |
277.2 |
|
Total Expenses |
517.6 |
1331.4 |
1234.4 |
1424.2 |
|
Profit/Loss Before Tax |
5.8 |
67.7 |
114.9 |
221.5 |
|
Total Tax Expenses |
-0.1 |
0.6 |
0.4 |
0.1 |
|
Profit/Loss After Tax Before Extraordinary Items |
6 |
67.1 |
114.5 |
221.3 |
|
Profit/Loss For The Period |
0.4 |
59.5 |
114.6 |
221.4 |
Cash Flow Statement (crore)
|
Year-end March |
FY18 |
FY19 |
FY20 |
FY21 |
|
|
5.8 |
67.7 |
114.9 |
221.5 |
|
Net Cash From Operating Activities |
49.2 |
159.9 |
244.2 |
155.5 |
|
Net Cash (used in)/from Investing Activities |
-85.5 |
-109.2 |
-358.8 |
-106.3 |
|
Net Cash (used in)/from Financing Activities |
67.7 |
-23.4 |
94.9 |
92.5 |
|
Net Cash and Cash Equivalents |
31.5 |
27.3 |
-19.7 |
141.7 |
|
Opening Cash & Cash Equivalents |
0 |
46 |
75.7 |
56 |
|
Closing Cash & Cash Equivalents |
46 |
75.7 |
56 |
197.7 |
Balance Sheet (crore)
|
As on 31-03-2021 |
FY18 |
FY19 |
FY20 |
FY21 |
|
EQUITIES AND LIABILITIES |
|
|
|
|
|
SHAREHOLDER'S FUNDS |
|
|
|
|
|
Equity Share Capital |
24.7 |
25.8 |
26.9 |
35.9 |
|
Total Share Capital |
24.7 |
25.8 |
26.9 |
35.9 |
|
Reserves and Surplus |
739.3 |
826.1 |
963.1 |
1552.6 |
|
Total Reserves and Surplus |
739.3 |
826.1 |
963.1 |
1552.6 |
|
Total Shareholders’ Funds |
764 |
851.9 |
989.9 |
1588.5 |
|
NON-CURRENT LIABILITIES |
|
|
|
|
|
Deferred Tax Liabilities [Net] |
48.4 |
32.8 |
11.8 |
0 |
|
Other Long Term Liabilities |
16.5 |
77.6 |
78.3 |
65.9 |
|
Long Term Provisions |
7.3 |
8.9 |
10.5 |
11.4 |
|
Total Non-Current Liabilities |
315.1 |
344.3 |
333.4 |
232.1 |
|
CURRENT LIABILITIES |
|
|
|
|
|
Trade Payables |
312.9 |
244.4 |
216.1 |
309.3 |
|
Other Current Liabilities |
93.6 |
195.1 |
158.1 |
116.7 |
|
Short Term Provisions |
1.3 |
1.6 |
1.9 |
1.8 |
|
Total Current Liabilities |
737.9 |
655.5 |
729.9 |
788.8 |
|
Total Capital And Liabilities |
1821.5 |
1960 |
2153.5 |
2613.6 |
|
ASSETS |
|
|
|
|
|
NON-CURRENT ASSETS |
|
|
|
|
|
Fixed Assets |
798.8 |
893.1 |
1072.3 |
1104.5 |
|
Total Non-Current Assets |
1213.7 |
1305.5 |
1481.5 |
1556 |
|
CURRENT ASSETS |
|
|
|
|
|
Total Current Assets |
607.8 |
654.6 |
672 |
1057.6 |
|
Total Assets |
1821.5 |
1960 |
2153.5 |
2613.6 |
Industry Overview
The Pharmaceutical industry is witnessing rapid advancements and the demand for APIs is well poised to grow in an organic manner. The Global pharmaceutical industry is expected to reach a valuation of USD 1.57 trillion by 2023. It is estimated that North America would continue to be the largest pharmaceutical market with a share of 45.33% by 2023. The Asia-Pacific is expected to overtake Europe (20.14%) as the second largest market with a market share of 24.07% by 2023. The pharmaceutical industry comprises of APIs, formulations and specialty chemicals. The Indian Pharmaceutical industry stood at USD 41.7 billion in 2020 and now the industry is estimated to witness a CAGR of 12% and reach USD 130 billion by 2030. Huge potential in both the domestic market and export market due to increasing awareness, ageing and growing population would contribute to this growth in India.
The Global API market stood at US $180.4 billion in 2020 and the market is expected to reach a valuation of US $284.3 billion by 2027 at an estimated CAGR of 6.7%. As per a report, China exports around USD 37 billion worth of API and India around USD 4 billion. China enjoyed the benefit of being a cost leader and is hence the leading exporter of APIs after North America. With the world adapting the strategy of China Plus One, it is expected that there would be a shift in APIs manufacturing centers from China to other Asian players. A market share shift of 10% from China to India would double India’s API market to USD 8 billion.
Globally, the growth propellers for this industry are increasing prevalence of chronic diseases and geographic expansion of API manufacturers. India is at the forefront in driving the global APIs market growth due to the increased production of generic drugs. The emerging trends in the Global API industry are increasing regulatory oversight, focus on supply chain reliability, concerns around competing interests and growing environmental concerns. The regulated markets are estimated to outgrow the less regulated markets. North America and Asia are expected to see the highest incremental growth until 2027.
India has the advantage of having the largest number of FDA plants after the US. The country’s share in Global Abbreviated New Drug Applications (ANDA) is increasing and is currently at 44%. India is on par with the Western countries on parameters such as process efficiency, technical capabilities and skilled workforce coupled with strict quality standards and manufacturing practices. Increasing labor costs in China and lower cost of skilled labor in the domestic market would be a competitive advantage to India resulting an increase in the market share. The Indian Government approved Rs 6940 crore towards Production Linked Incentive (PLI) scheme for promotion of manufacturing of critical Key Starting Materials (KSMs) or Drug Intermediaries (DI) and APIs domestically in India.
The Indian API industry is witnessing an increased dependence on imports of several KSMs, APIs and Intermediaries. The import of APIs grew at a CAGR of 8.3% during 2012-2019. The major reason for increasing imports is the abundant supply of APIs at low-cost. Major companies in the Indian API market include Neuland, Solara, Granules India, Aarti Drugs, Divi’s Labs, Laurus Labs and others.
Peer Comparison
Recommendation Rationale
Solara Active even though being a young company, has almost 30+ years of experience in the Indian pharmaceutical industry. The company traces its existence to the API expertise of Strides Ltd. and the technical expertise of human API business from Sequent Scientific Ltd. Solara grew exceptionally well in FY21 at a rate of 47% in North America, 38.5% in APAC and 11% in Europe when compared to the last year. In the last 4 years of its existence, the company’s market capitalization grew over 10 times and Solara became a pure play API company by strengthening its portfolio, high customer centricity and reliable supply assurance.
Solara has 40+ active products across therapeutic areas, with the top 10 products contributing a major portion to sales. This leaves the company with sufficient scope to improve sales from the remaining products. The company is also expanding its product portfolio to cover other therapeutic areas and also specializing in certain categories like anti-malaria, anti-psychotic, anti-infective, cardiovascular agents, anesthetics and others. Solara realizes majority of its revenue from regulated markets like North America, Europe, APAC, and South America. It has the opportunity to grow its presence in the unregulated markets and increase its revenue from new markets at a higher rate.
The company aims to become a top 10 player in the world. In order to achieve that, the company is acting on a strategy based on four pillars. Base products, New products, CRAMS and Inorganic growth are considered to be the four pillars of the strategy.
-
The plant at Vizag is expected to make the company a cost leader in the market in Ibuprofen business, as this facility provides fully backward integration for the product. On all the base products, the company has seen an increase in its sales with key customers in regulated markets.
-
The company’s new products are increasing and along with that, the demand for the launched products is also rising. R&D facility of the company has developed seven new products in Q1 of FY22 and it also filed for DMFs. The company looks forward to commercializing at least two of the DMFs by the end of FY22.
-
CRAMS segment of the company contributed only 9.6% to the total sales in FY21. The sales contribution from this segment is believed to improve as the company has added new customers in this quarter.
-
The company follows the strategy of inorganic growth to accelerate its growth especially CRAMS business. It aims to double its business from the CRAMS segment in the next four years.
Solara’s merger with Aurore Life Science, Empyrean Lifesciences and Hydra Active Pharma Sciences made company the second largest API/CRAMS player in the country. Aurore is involved in developing a wide range f generic pharmaceutical products. Aurore realizes revenue of around Rs 150 crore from its CRAMS segment. This CRAMS revenue addition to Solara’s would make it reach a meaningful size and will be able to benefit from R&D capabilities, economies of scale, broad customer base and an increase in the number of products both horizontally and vertically. Solara identified synergies worth Rs 150 crore to Rs 200 crore every year and this would flow into the company in the next 12-14 months.
Solara’s revenue dependency on Ibuprofen is high. It realizes almost 27% of its revenue from Ibuprofen and a total of 46% from 3 APIs- Ibuprofen, Praziquantel, and Gabapentin. The Price of Ibuprofen API decreased in the global market. But this price factor doesn’t affect the company much as the company has entered into long term contracts with its customers at a fixed rate. The company faces issues in the aspect of demand, as the demand for Ibuprofen APIs fell across the global market. The company is hopeful that demand would pick up soon.
The company used to realize around 66% of revenue from regulated markets and 34% from unregulated markets. But an effect in the demand for Ibuprofen API made the company look towards unregulated markets and there was a massive shift in the sales mix. The company now realizes around 65% from unregulated markets and 35% from regulated markets. Despite this shift in sales mix, the company’s revenues did not take any hit. Solara management’s proactive approach and the plants’ readiness to produce different APIs accordingly ensured the continuity of revenue realization.
Valuation
Solara Active Pharma Science delivered a solid performance, with EBITDA margin growing to 24% in FY21 from 14% in FY18. Net Profit also grew from Rs 0.4 crore in FY18 to Rs 221 crore in FY21. Solara further aims to become a top 10 global player and achieve a revenue CAGR of 25% over FY21-25. Solara’s net debt to equity ratio reduced from 0.6 in FY20 to 0.26 in FY21. The company’s EPS is increasing at a good rate and it had an EPS of 64.5 in the last year. The company is currently trading at a P/B ratio of 2.37. We calculate the 3-year average EPS of the company at 43, while the sector P/E is 37.7. Valuing the stock at sector P/E of 37.7 on a 3-year average EPS of Rs 43, we initiate coverage on Solara with Buy and a 1-year Target price of Rs 1620. Institutional investors have increased their holdings in the company to 23.34% from 23.01% in the quarter of September 2021. BUY
- Share :


Post a Comment
|
DISCLAIMER |
This report is only for the information of our customers. Recommendations, opinions, or suggestions are given with the understanding that readers acting on this information assume all risks involved. The information provided herein is not to be construed as an offer to buy or sell securities of any kind. ATS and/or its group companies do not as assume any responsibility or liability resulting from the use of such information.