TATA ELXSI
Tata Elxsi Ltd is engaged in product design and engineering services to the consumer electronics, communications & transportation industries and systems integration and support services for enterprise customers.
Tata Elxsi Ltd - Key Parameters
|
BSE Code |
500408 |
|
NSE Code |
TATAELXSI |
|
Reuters Code |
TTEX.NS |
|
INCEPTION |
1989 |
|
IPO |
1996 |
|
CMP (as on 23/09/2015) |
1820 |
|
Stock Beta |
1.086 |
|
52 Week H/L |
551.10 / 2317 |
|
Market Cap (Cr) |
5764.71 |
|
Equity Capital (Rs cr) |
31.14 |
|
Face Value (Rs) |
10 |
|
Average Volume |
10,17,780 |
|
|
|
|
Shareholding Pattern (%) |
|
|
Promoters |
45 |
|
Non Institutions |
43 |
|
Institutions |
12 |
|
Grand Total |
100.00 |
Tata Elxsi Ltd - Potential Catalysts
-
New design for Embedded Products
-
Government Initiatives
-
Auto and telecast portions set for exponential development
-
Human machine interface (HMI) – likewise seeing ocean change
Tata Elxsi Ltd - Recommendation
With Superior project management skills, focus on measuring and monitoring quality and its planned expansion Tata Elxsi Ltd will be able to grow over the next few years. We recommend BUY on the stock at CMP of Rs. 1820 to target of Rs. 2155 (Forward PE of 53.71x FY16).
Tata Elxsi Ltd - Financial Summary
|
Yearly Income Statement |
2014 |
2015 |
2016 E |
2017 E |
|
Revenue |
787.33 |
852.75 |
999.84 |
1156.69 |
|
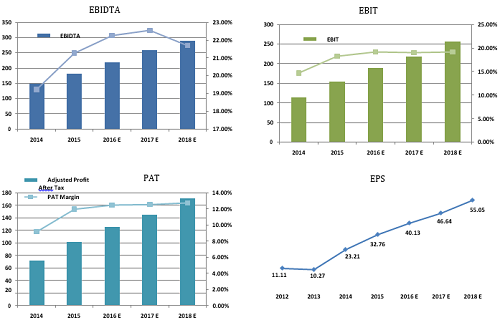
EBIDTA |
149.00 |
180.66 |
219.74 |
258.85 |
|
EBIT |
114.01 |
155.13 |
189.35 |
218.37 |
|
Adjusted Profit After Tax |
72.26 |
102.02 |
124.97 |
145.21 |
|
EPS (Unit Curr.) |
23.21 |
32.76 |
40.13 |
46.64 |
|
EBIDTA Margin |
19.23% |
21.27% |
22.26% |
22.55% |
|
EBIT Margin |
14.71% |
18.26% |
19.18% |
19.03% |
|
PAT Margin |
9.18% |
11.96% |
12.50% |
12.55% |
BUSINESS DISCRIPTION
Tata Elxsi Limited was incorporated in 1989 and is headquartered in Bengaluru, India. It provides product design and engineering, and systems integration and support services in India, Dubai, France, Germany, Japan, the United Kingdom, Ireland, and the United States.
It operates through two segments, Software Development & Services; and Systems Integration & Support. It offers embedded product design services, including technology consulting, product development, and testing services for product companies, service providers, and start-ups; and creates and licenses intellectual property and software components. It also provides industrial design services, such as research and strategy, branding and graphic design, product and packaging design, UI design, retail design and signage, transportation design, design engineering, and prototype development. In addition, it offers visual computing labs services comprising animation and visual effects for feature films and episodic television; and for TV commercials and corporate videos for visualization and new product launches.
Further, the company provides systems integration services, such as implementing and integrating systems and solutions for broadcast, CAD/CAM/CAE/PLM, disaster recovery, high-performance computing, and storage and virtual reality; and professional services, including maintenance and support services for data mining, storage, IT facilities, and network management. It serves the aerospace, automotive, broadcast, consumer electronics, defense and public safety, healthcare, media and entertainment, networking and telecom, retail and consumer goods, and semiconductor industries.
MANAGEMENT & GOVERNANCE
|
Name |
Designation |
|
P McGoldrick |
Director |
|
P G Mankad |
Director |
|
R Natarajan |
Director |
|
Madhukar Dev |
Managing Director & CEO |
|
G Vaidyanathan |
Company Secretary |
|
Shyamala Gopinath |
Director |
|
N G Subramaniam |
Chairman |
|
Gopichand Katragadda |
Director |
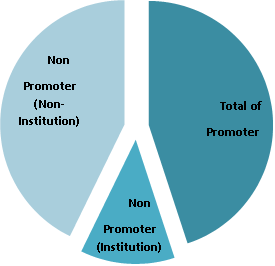
Shareholding pattern as on 30thJune, 2015
|
Share Holding Pattern |
No of Shares |
|
Total of Promoter |
13997288 |
|
|
|
|
Government(Central / State) |
200 |
|
Financial Institutions / Banks |
34788 |
|
Foreign Institutional Investors |
2609901 |
|
Foreign Institution Others |
68024 |
|
Insurance Companies |
788643 |
|
Mutual Funds / UTI |
320562 |
|
Non Promoter (Institution) |
3822118 |
|
|
|
|
Bodies Corporate |
1823928 |
|
Directors & their Relatives |
1100 |
|
Individuals holding |
11485176 |
|
Trust & Foundation |
8610 |
|
Non Promoter (Non-Institution) |
13318814 |
|
|
|
|
Grand Total |
31138220 |
|
EQUITY - FUND HOLDINGS |
No of Shares Sep2015 |
No of SharesAug2015 |
|
Canara Robeco Mutual Fund |
189229 |
185229 |
|
Goldman Sachs Mutual Fund |
258 |
258 |
|
L&T Mutual Fund |
16160 |
16160 |
|
Motilal Oswal Mutual Fund |
217515 |
192515 |
|
Taurus Mutual Fund |
15892 |
15892 |
INDUSTRY OUTLOOK
Enterprise software is in the midst of a revolution. Today, everyone's a power user. 2014 was all about the ―consumerization‖ of enterprise software -- software companies redefining the user experience to make technology more closely resemble consumer applications. This will continue in this year as developers move away from a purely utilitarian approach to creating software that‘s more intuitive, more user-friendly and able to cater to users‘ changing needs.
TRENDS IN DEMAND ENVIRONMENT Enterprise Software
-
Gartner estimate the $310bn spend in 2015 growing to $396bn in 2019
-
IT Services – Applications Services (Implementation) worth $158bn in 2015, growing to $177bn in 2019
-
Digitalization – $170bn market growth from 2014-2019. $36bn in digital consulting and implementation, $13bn in digital consulting
-
Increased investment – CEOs intend to raise investment in IT and Digital Capabilities more than any other aspect of their business in 2015.
Increase in global technology spending and opportunities created through adoption of disruptive technologies are expected to propel growth in FY2015. NASSCOM expects the industry to clock export revenues of USD 84-87 billion maintaining a growth rate of 12-14 per cent. Domestic revenues will also grow at a rate of 13-15 per cent and are expected to reach INR 1180-1200 bn.
INVESTMENT RATIONALE
Embedded Product Design
The Embedded Product Design division provides technology consulting, new product development, system integration, and testing services for the broadcast, industrial and consumer electronics, transportation, wireless communications, and convergence industries. It also creates and licenses intellectual property and software components, helping customers create product differentiation and reduce development costs and time-tomarket.
Industrial Design
The Industrial Design division helps customers develop winning brands and products by using design as a strategic tool for business success. Its expertise extends across consumer insight, branding, product design, packaging design, transportation design, visual design, design engineering, and manufacturing support. This division has worked with prestigious FMCG brands in packaging design. It has developed award-winning designs in the food, beverage, personal and home care segments, for leading brands in India and Overseas.
Visual Computing Labs
Visual Computing Labs offers Animation, Visual Effects (VFX), and 3D stereoscopic content for feature films, episodic television and advertising. It also offers custom content development for visualization and product marketing, and is a leading provider of engineering and animation services for mobile, online and console games.
VCL has worked with leading international studios like FOX, Disney, Sony and Columbia Pictures, Industrial Light & Magic, MGM, on some of their features including Jack The Giant Slayer, Gullivers Travels, The Darkest Hour, Terminator 4, Ironman, Indiana Jones, Spiderman 3, Into the blue, Ghostrider, XXX 2 etc. VCL continues to execute visual effects for a number of Bollywood films like Ra-One, New York, Prince, Rab Ne Bana DI Jodi, Drona, Bachna Ae Haseeno, Jodhaa Akbar, Taare Zameen Par, Dhoom 2, Rang De Basanti and many more.
VCL has also worked on numerous television commercials for leading brands like Bisleri Mountain Water, Videocon Innovation Labs, Panasonic Eco Navi, Samsung Mobile, Sony, Toyota Corolla Altis, Chevrolet, Honda, Elf Moto, MSN, Nissin, Reebok, Lux, Kelloggs, Pillsbury, Coke, Colgate, Pepsi, Thums Up, Wrigley, Cheetos, Pillsbusy, to name a few.
Government Initiatives
The adoption of key technologies across sectors spurred by the 'Digital India Initiative' could help boost India's gross domestic product (GDP) by US$ 550 billion to US$ 1 trillion by 2025, as per research firm McKinsey.
Some of the major initiatives taken by the government to promote IT and ITeS sector in India are as follows:
India and the United States (US) have agreed to jointly explore opportunities for collaboration on implementing India's ambitious Rs 1.13 trillion (US$ 18.22 billion) ‗Digital India Initiative‘. The two sides also agreed to hold the US-India Information and Communication Technology (ICT) Working Group in India later this year.
India and Japan held a Joint Working Group conference for Comprehensive Cooperation Framework for ICT. India also offered Japan to manufacture ICT equipment in India.
The Government of Telangana began construction of a technology incubator in Hyderabad—dubbed T-Hub to reposition the city as a technology destination. The state government is initially investing Rs 35 crore (US$ 5.64 million) to set up a 60,000 sq ft space, labelled the largest start-up incubator in the county, at the campus of International Institute of Information Technology-Hyderabad (IIIT-H). Once completed, the project is proposed to be the world‘s biggest start-up incubator housing 1,000 start-ups.
Auto and telecast portions set for exponential development
Software, which included 2% of aggregate estimation of a vehicle in 2000, now involves 15% of the aggregate esteem and is required to reach 20% by 2020. By 2020, there will be a quarter billion joined vehicles out and about, empowering new in-vehicle administrations and computerized driving abilities, as indicated by Gartner. Key zones for development in the car vertical incorporate Infotainment (40% of incomes), Powertrain and Hybrids (40% of incomes), and Safety and Security (20% of incomes).
Likewise, we expect solid development in telecast fragment drove by speculations by administrators in creating more up to date administrations and elements. Car and telecast together record for ~75% of TELX's EPD incomes and have been key development drivers (CAGR of 49% and 41%, separately over FY12-14). We expect high development in both these key portions to proceed with (CAGR of 25% and 15%, separately over FY15-17).
Human machine interface (HMI) – likewise seeing ocean change
The HMI or human machine interface is likewise experiencing noteworthy change, with physical handles being supplemented by touch screens, controlling wheel controls, sound summons and up and coming motion based charges. Most recent components incorporate heads-up showcase that activities key parameters onto the windscreen before the driver, and personalization of the vehicle and infotainment settings in view of the auto perceiving the driver and his/her inclination
Dividend
|
Year End |
Dividend-Amount |
Dividend-% |
|
2015 |
34.25 |
110 |
|
2014 |
28.02 |
90 |
|
2013 |
15.57 |
50 |
|
2012 |
21.8 |
70 |
|
2011 |
21.8 |
70 |
|
2010 |
21.8 |
70 |
|
2009 |
21.8 |
70 |
|
2008 |
21.8 |
70 |
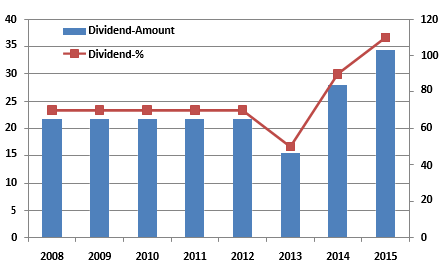
One of the advantages to shareholders in the respect of stock dividends is the tax benefit. The receipt of the stock dividends by the shareholder is not taxable as income. The payment of stock dividend is normally interpreted by shareholders as an indication of higher profitability.
In the present unpredictable market conditions, picking stocks with high dividend yields is a good strategy for those who are here to invest with a long-term goal as such stocks gives investors fairly regular dividends, plus the capital appreciation could also be fairly good.
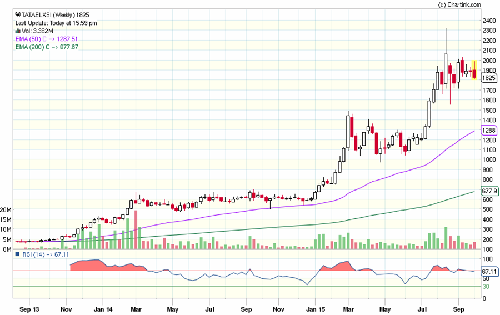
VALUATION
Tata Elxsi Ltd is currently trading at 1820 per share with a market capitalization of 5764.17 Crores. It has no debt in its balance sheet and has 0.01 D/E for short term which is used for Working Capital requirements. It has total cash and bank balance of 133.26 Cr versus 51.46 Cr last year and it has Cash & Cash equivalent of173.9 Cr for FY15. Its payout increased to 41% (FY15) from 35.98% last year (FY14).
|
|
201403 |
201503 |
|
Key Ratios |
||
|
Debt-Equity Ratio |
0.14 |
0 |
|
Long Term Debt-Equity Ratio |
0 |
0 |
|
Current Ratio |
1.35 |
1.75 |
|
Turnover Ratios |
||
|
Fixed Assets |
3.86 |
4.13 |
|
Debtors |
5.22 |
5.49 |
|
Total Asset Turnover Ratio |
3.1 |
3.18 |
|
Interest Cover Ratio |
43.65 |
232.52 |
|
ROCE (%) |
45.96 |
58.24 |
|
RONW (%) |
33.54 |
39.3 |
|
Payout (%) |
41.12 |
35.98 |
We value Tata Elxsi Ltd using DCF at price target of 2155 for FY16 with expected growth rate at 16.24% per annum. For valuation we assume that over the period company will keep capital structure unaltered and tax rate unchanged.
|
2015 |
|
|
Equity |
31.14 |
|
Face Value |
10 |
|
Market Capitalization |
5764.17 |
|
Enterprise Value |
5631.37 |
|
Current PE |
55.56 |
|
Book Value |
90.99 |
|
P/BV |
20.00 |
|
Equity Dividend |
34.25 |
|
Dividend Yield-% |
0.59 |
|
(in Cr.) |
Rolta India |
Mindtree |
KPIT Tech. |
Cyient |
Zensar Tech. |
|
Average |
TATA Elxsi |
|
Sales |
3679.46 |
3561.9 |
2989.92 |
2735.93 |
2655.78 |
|
852.75 |
|
|
PAT |
245.17 |
536.3 |
236.99 |
335.93 |
264.63 |
|
102.02 |
|
|
Equity |
161.33 |
83.7 |
37.61 |
56.18 |
44.33 |
|
31.14 |
|
|
EPS |
14.59 |
60.6 |
12.37 |
28.36 |
57.58 |
34.70 |
32.76 |
|
|
PE |
10.69 |
20.36 |
15.62 |
16.84 |
10.75 |
14.85 |
55.56 |
|
|
BV |
77.77 |
240.43 |
68.88 |
164.12 |
261.01 |
|
90.99 |
|
|
P/BV |
2.09 |
5.43 |
2.86 |
3.07 |
2.46 |
3.18 |
20.00 |
|
|
|
||||||||
|
OPM % |
35.93 |
22.25 |
11.98 |
19.1 |
15.76 |
|
21.00 |
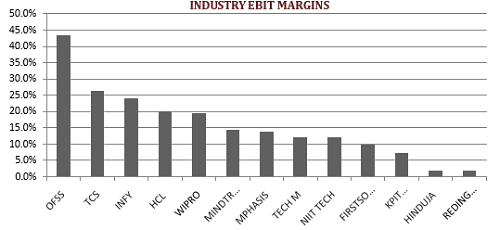
18.26% |
|
NPM % |
6.66 |
15.06 |
7.93 |
12.28 |
9.96 |
10.38 |
11.96% |
|
|
|
||||||||
|
LTP |
105.4 |
1463.45 |
111.45 |
570.65 |
825.95 |
|
|
925 |
CONCUSSION AND RECOMMENDATION
With Superior project management skills, focus on measuring and monitoring quality and its planned expansion Tata Elxsi Ltd will be able to grow over the next few years. We recommend BUY on the stock at CMP of Rs. 1820 to target of Rs. 2155 (Forward PE of 53.71x FY16).
RISKS AND CONCERNS
-
The current trend of weakness in the rupee will contribute to the profitability of export oriented companies.
On the flip side, if the rupee depreciated beyond 65-66 against the dollar, Tata Elxsi Ltd may end up reporting realized foreign exchange (Forex) losses since it has sold a portion of its future dollar revenue at 64-65 levels in forward currency markets. It has a hedge position of $1.4 billion at an average rupee rate of 65 against the dollar. Therefore, a rupee rate above this threshold will cause a Forex loss as and when the company realizes revenue.
-
TATA ELXSI deals in the world-wide market. The different market dynamics have a slight bearing on the operations of the company. The Gains of Tata Elxsi Ltd Technologies is significantly inter- linked with the growth of the Banking Industry all over the Globe.
-
The rapidly developing markets and the Competition in the market is a major concern for TATA ELXSI
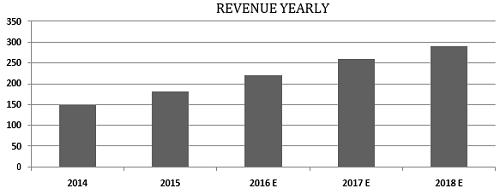
FINANCIALS
Tata Elxsi Ltd., incorporated in the year 1989, is a Mid Cap company operating in Information Technology sector.
For the quarter ended 30-Jun-2015, the company has reported Standalone sales of Rs. 243.52 Cr., up 5.29% from last quarter Sales of Rs. 231.28 Cr. and up 27.66% from last year same quarter Sales of Rs. 190.75 Cr. Company has reported net profit after tax of Rs. 35.72 Cr. in latest quarter.
|
Yearly Income Statement |
2014 |
2015 |
2016 E |
2017 E |
2018 E |
|
Net Sales |
774.79 |
849.4 |
987.34 |
1147.69 |
1334.07 |
|
Other Income |
12.54 |
3.35 |
12.50 |
9.00 |
9.00 |
|
Total Income |
787.33 |
852.75 |
999.84 |
1156.69 |
1343.07 |
|
Total Expenditure |
638.33 |
672.08 |
780.10 |
897.84 |
1053.65 |
|
EBIDTA |
149 |
180.66 |
219.74 |
258.85 |
289.42 |
|
Depreciation |
34.99 |
25.54 |
30.40 |
40.48 |
33.58 |
|
EBIT |
114.01 |
155.13 |
189.35 |
218.37 |
255.85 |
|
Interest |
1.83 |
0 |
0.00 |
0.00 |
0.00 |
|
PBT |
112.18 |
155.13 |
189.35 |
218.37 |
255.85 |
|
Tax |
39.92 |
53.1 |
64.38 |
73.15 |
84.43 |
|
Adjusted Profit After Tax |
72.26 |
102.02 |
124.97 |
145.21 |
171.42 |
|
|
|||||
|
Equity |
31.14 |
31.14 |
31.14 |
31.14 |
31.14 |
|
EPS (Unit Curr.) |
23.21 |
32.76 |
40.13 |
46.64 |
55.05 |
|
|
|||||
|
EBIDTA Margin |
19.23% |
21.27% |
22.26% |
22.55% |
21.69% |
|
EBIT Margin |
14.71% |
18.26% |
19.18% |
19.03% |
19.18% |
|
PAT Margin |
9.18% |
11.96% |
12.50% |
12.55% |
12.76% |
|
Quarterly Income Statement |
201409 |
201412 |
201503 |
201506 |
201509 E |
|
Net Sales |
205.88 |
221.49 |
231.28 |
243.52 |
244.01 |
|
Other Income |
1.32 |
1.09 |
-0.51 |
7.57 |
6.15 |
|
Total Income |
207.2 |
222.58 |
230.77 |
251.09 |
250.16 |
|
Total Expenditure |
164.09 |
170.99 |
183.88 |
187.48 |
190.08 |
|
EBIDTA |
43.11 |
51.59 |
46.89 |
63.61 |
60.08 |
|
Depreciation |
7.88 |
7.28 |
1.41 |
9 |
8.22 |
|
EBIT |
35.23 |
44.31 |
45.48 |
54.61 |
51.85 |
|
Interest |
0 |
0 |
0 |
0.01 |
0.00 |
|
PBT |
35.23 |
44.31 |
45.48 |
54.6 |
51.85 |
|
Tax |
11.6 |
15.71 |
15.64 |
18.88 |
17.63 |
|
Adjusted Profit After Tax |
23.63 |
28.6 |
29.84 |
35.72 |
34.22 |
|
|
|
||||
|
Outstanding Shares |
31138220 |
31138220 |
31138220 |
31138220 |
31138220 |
|
EPS |
7.59 |
9.18 |
9.58 |
11.47 |
10.99 |
|
|
|
||||
|
EBIDTA Margin |
20.94% |
23.29% |
20.27% |
26.12% |
24.62% |
|
EBIT Margin |
17.11% |
20.01% |
19.66% |
22.43% |
21.25% |
|
PAT Margin |
11.40% |
12.85% |
12.93% |
14.23% |
13.68% |
- Share :


Post a Comment
|
DISCLAIMER |
This report is only for the information of our customers. Recommendations, opinions, or suggestions are given with the understanding that readers acting on this information assume all risks involved. The information provided herein is not to be construed as an offer to buy or sell securities of any kind. ATS and/or its group companies do not as assume any responsibility or liability resulting from the use of such information.