TV18 Broadcast Limited Research Report
|
Market Price |
Recommendation |
Target |
Time Horizon |
|
31.90 |
Buy |
45 |
1-Year |
TV18 Broadcast Limited - Q3FY2023 REVIEW
TV18 Broadcast Limited reported net revenue of ₹1768 crores for the quarter ended December 31, 2022, compared to ₹1,567 crores for December 30, 2021. Profit After Tax was ₹38 crores for the quarter ended December 31, 2022, compared to ₹311 crores during the corresxponding quarter of the previous year, respectively.
STOCK DATA
|
52 Week H/L |
30.45/82.60 |
|
Market Cap (crores) |
5,468 |
|
Face Value (₹) |
2.00 |
|
Book Value |
36.66 |
|
EPS TTM |
3.41 |
|
NSE Code |
TV18BRDCST |
TV18 Broadcast Limited - OVERVIEW
-
On April 27, 2022, Reliance and Viacom18 announced a strategic alliance with Bodhi Tree Systems, a platform of James Murdoch's Lupa Systems and Uday Shankar, to create one of India's biggest TV and digital streaming businesses. To invest Rs 13,500 crore in Viacom18 and to pioneer the change of the Indian media landscape to a "streaming-first" strategy, Bodhi Tree Systems is spearheading fundraising with a group of investors. The goal of the fundraise is to develop India's top entertainment platform.
-
Viacom18 announced that it had purchased the rights to digitally stream Indian Premier League games on the Indian subcontinent for the seasons 2023 to 2027 on June 15, 2022. Moreover, it has been awarded digital rights for 18 titles in a unique package for India.
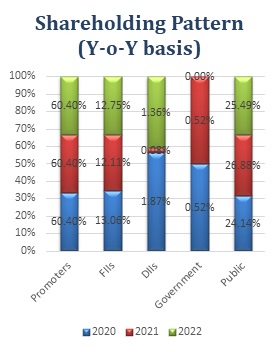
SHAREHOLDING PATTERN (%)
|
|
June-22 |
Sep-22 |
Dec-22 |
|
Promoter |
60.40 |
60.40 |
60.40 |
|
Public |
27.63 |
28.14 |
29.41 |
|
FII |
10.25 |
9.85 |
5.58 |
|
DII |
1.72 |
1.60 |
1.60 |
|
Governmemnt |
0.00 |
0.01 |
0.00 |
BENCHMARK COMPARISON
Beta: 0.66 |
Alpha: -5.20 |
Risk Reward Ratio: 1.67 |
Margin of Safety: 26% |
BUSINESS
-
One of India's most diversified media and entertainment(M&E) conglomerates, Network18 Group, owns TV18 Broadcast Limited (TV18), which has interests in television, digital content, filmed entertainment, e-commerce, print, and related businesses. Network18 Group is a subsidiary of Network18 Media & Investments Limited (Network18 Group).
-
With 14 channels across India, including a joint venture called News18-Lokmat, TV18 runs the country's largest news network, including business news (4 channels), general news (1 channel each in English and Hindi), and regional news.
-
This news collection includes the leading brands of the company, such as CNBC-TV18, News18 India, and CNN News18. News18 International provides authoritative Indian news for people throughout the world and the Indian diaspora.
-
The subsidiary firm of TV18, Viacom 18 (a partnership with Paramount Global), runs a variety of television entertainment channels as well as a digital platform. Sports, English entertainment, youth, and music programming, kids' programming, and general entertainment channels are all included in the TV portfolio. These channels are also available in Hindi and other regional languages. Among this portfolio's top brands include Colors, MTV, and Nickelodeon.
-
Moreover, Voot, an OTT (Over the Top) platform run by Viacom 18, provides premium and unique programming in addition to catch-up TV for on-demand watching. Via its studio, Viacom 18 Motion Pictures, the Group is also active in the movie production and distribution industries. A+E Networks and TV18's infotainment division, AETN18, runs the fact-based entertainment channel History TV18.
-
IndiaCast, a joint venture between TV18 and Viacom 18, is a multi-platform content asset monetisation organisation that distributes high-quality Indian content to audiences throughout the world. It also drives content syndication for the Group's channels and content in both local and foreign markets.
-
In order to comply with the Securities and Exchange Board of India (Substantial Acquisition of Shares and Takeovers) Regulations 2011 and acquire control of the Company during the year 2014, Independent Media Trust (IMT), of which Reliance Industries Limited is the sole beneficiary, made an open offer to the Company's shareholders. This offer was accepted during the following year, 2015.
-
The Company's Board of Directors approved a composite merger and arrangement between Den Networks Limited, Hathway Cable and Datacom Limited, Network18 Media & Investments Limited, Media18 Distribution Services Limited, Web18 Digital Services Limited, and Digital18 Media Limited, as well as each of their respective shareholders and creditors, at its meeting on February 17, 2020.
SWOT ANALYSIS
STRENGTH
-
Company with low debt
-
Experienced Management
-
Diversified content offering with a dominant position.
-
Comfortable capital structure.
WEAKNESS
-
Highest fall from 52 weeks.
-
The decline in quarterly net profit with falling profit margin.
-
Increase in the expenditure of the company.
OPPORTUNITIES
-
The parentage of the strong and resourceful Reliance group.
-
The strategic importance of the media and entertainment business.
THREAT
-
Volatility in advertisement revenue.
-
Inherent working capital-intensive operations.
MEDIA AND ENTERTAINMENT INDUSTRY ANALYSIS
-
Audiences of all ages and demographics consume media through a variety of channels, including television, movies, out-of-home (OOH), radio, animation, and visual effects (VFX), as well as through music, video games, digital advertising, live events, filmed entertainment, and print.
-
India is ranked fourth for "ICT Services Exports." The OTT, gaming, animation, and VFX sectors are predicted to drive India's Media & Entertainment sector's 10-12% CAGR growth to $55-70 Billion by 2030.
-
There is an increasing need for local content. By 2025, it is anticipated that regional programming would make up 60% of TV and 50% of OTT consumption, respectively.
-
Indian media and entertainment income is projected to increase by 12–14% to Rs. 1.6 lakh crore in FY24.
-
Digital channels, followed by TV and print, will see the fastest rise in advertising income for the Indian media and entertainment (M&E) industry. Given its close relationship to economic activity, advertising income, which makes up 55% of the sector's revenue, will increase by 14%. Also, a rise in ad expenditure is anticipated in the last quarter of the next fiscal year due to the general elections anticipated in mid-2024. Subscription income, which would rise at a slower rate of 12%, would account for the remaining 45%.
-
The Indian government has undertaken several initiatives, including digitizing the cable distribution industry to attract more institutional funding, raising the FDI ceiling in cable and direct-to-home (DTH) satellite platforms from 74% to 100%, and giving the film industry status to facilitate easy access to institutional financing.
-
The Government of India's Ministry of Information & Broadcasting established the Film Facilitation Office (FFO), which serves as a single point of contact for producers and production firms to receive the necessary filming licences.
-
From $ 21.4 Billion in the FY 2020–21 to $ 44.4 Billion in the FY 2021–22, the export of petroleum products climbed by 107.47%. Additionally, petroleum product exports from April to December 2022 were $70.28 billion, up 52.15% from the $46.19 billion exported from April to December 2021.
TV18 Broadcast Limited - FINANCIAL OVERVIEW
QUARTERLY SUMMARY
|
Quarterly (INR in Crores) |
Dec-22 |
Sep-22 |
Jun-22 |
Mar-22 |
|
Value Sales and Services |
2,073 |
1,726 |
1,474 |
1,744 |
|
Goods and Services Tax Included in Above |
-305 |
-253 |
-209 |
-248 |
|
Other Income |
55 |
10 |
30 |
16 |
|
Total Income |
1,823 |
1,483 |
1,295 |
1,512 |
|
|
|
|
|
|
|
Total Expenditure |
1,782 |
1,460 |
1,233 |
1,269 |
|
EBIT |
41 |
23 |
62 |
243 |
|
|
|
|
|
|
|
Finance Cost |
31 |
25 |
11 |
10 |
|
EBT before share of Profit/(Loss) of Associates and Joint Ventures |
10 |
-2 |
51 |
233 |
|
|
|
|
|
|
|
Share of Profit/(Loss) of Associates and Joint Ventures |
14 |
12 |
9 |
14 |
|
PBT |
24 |
10 |
60 |
247 |
|
|
|
|
|
|
|
Tax Expenses |
-14 |
- |
- |
27 |
|
PAT |
38 |
10 |
60 |
220 |
TV18 Broadcast Limited - PROFIT AND LOSS STATEMENT (₹ in Crores)
|
|
Mar-20 |
Mar-21 |
Mar-22 |
|
Value Sales and Services |
5,985 |
5,227 |
6,432 |
|
Goods and Services Tax Included in Above |
-810 |
-729 |
-906 |
|
Other Income |
82 |
62 |
75 |
|
Total Income |
5,257 |
4,560 |
5,601 |
|
|
|
|
|
|
Operational Costs |
2,368 |
1,751 |
2,326 |
|
Marketing, Distribution, and Promotional Expense |
866 |
796 |
992 |
|
Employee Benefits Expense |
893 |
836 |
897 |
|
Other Expenses |
345 |
306 |
273 |
|
EBITDA |
785 |
870 |
1,114 |
|
|
|
|
|
|
Depreciation and Amortisation Expense |
166 |
139 |
113 |
|
EBIT |
619 |
731 |
1,001 |
|
|
|
|
|
|
Finance Costs |
142 |
88 |
38 |
|
EBT before share of Profit/(Loss) of Associates and Joint Ventures |
478 |
644 |
963 |
|
|
|
|
|
|
Share of Profit/(Loss) of Associates and Joint Ventures |
39 |
60 |
54 |
|
EBT before Exceptional Items |
517 |
703 |
1,016 |
|
|
|
|
|
|
Exceptional Items |
-15 |
- |
- |
|
EBT |
502 |
703 |
1,016 |
|
|
|
|
|
|
Tax Expense |
85 |
-42 |
90 |
|
PAT before Non-Controlling |
417 |
746 |
926 |
|
|
- |
- |
- |
|
Non-Controlling |
-174 |
-290 |
-342 |
|
PAT |
242 |
456 |
585 |
|
|
|
|
|
|
EPS |
|
|
|
|
Basic |
1.41 |
2.66 |
3.41 |
|
Diluted |
1.41 |
2.66 |
3.41 |
|
|
|
|
|
|
Number of Shares |
|
|
|
|
Basic |
171.44 |
171.44 |
171.44 |
|
Diluted |
171.44 |
171.44 |
171.44 |
TV18 Broadcast Limited - Balance Sheet (₹ in Crores)
|
|
Mar-20 |
Mar-21 |
Mar-22 |
|
ASSETS: |
|
|
|
|
Non-Current Assets: |
|
|
|
|
Property, Plant and Equipment |
388.05 |
360.99 |
322.28 |
|
Capital Work-in-Progress |
11.59 |
4.35 |
3.19 |
|
Goodwill |
1,927.15 |
1,927.15 |
1,927.15 |
|
Other Intangible Assets |
44.96 |
33.00 |
24.67 |
|
Intangible Under Development |
75.07 |
121.44 |
255.77 |
|
Finance Assets: |
|
|
|
|
Investments |
397.73 |
459.94 |
515.61 |
|
Loans |
- |
- |
- |
|
Other Financial Assets |
40.45 |
32.98 |
30.40 |
|
Deferred Tax Assets |
49.01 |
15.74 |
4.25 |
|
Other Non-Current Assets |
571.88 |
536.28 |
425.98 |
|
Total Non-Current Assets |
3,505.89 |
3,491.87 |
3,509.30 |
|
|
|
|
|
|
Current Assets: |
|
|
|
|
Inventories |
2,031.10 |
1,884.10 |
2,579.84 |
|
Financial Assets: |
|
|
|
|
Investments |
21.92 |
29.48 |
64.63 |
|
Trade Receivables |
1,491.08 |
1,228.70 |
1,090.85 |
|
Cash and Cash Equivalents |
113.62 |
325.25 |
332.79 |
|
Other Bank Balances |
0.86 |
0.84 |
1.30 |
|
Loans |
665.31 |
710.29 |
817.30 |
|
Other Financial Assets |
190.29 |
191.54 |
211.01 |
|
Other Current Assets |
388.79 |
360.08 |
593.83 |
|
Total Current Assets |
4,902.97 |
4,730.28 |
5,691.55 |
|
|
|
|
|
|
Total Assets |
8,408.86 |
8,222.15 |
9,200.85 |
|
|
|
|
|
|
EQUITY AND LIABILITIES: |
|
|
|
|
Equity: |
|
|
|
|
Equity Share Capital |
342.87 |
342.87 |
342.87 |
|
Other Equity |
3,390.73 |
3,848.46 |
4,436.80 |
|
Equity Attributable to Owners of the Company |
3,733.60 |
4,191.33 |
4,779.67 |
|
|
|
|
|
|
Non-Controlling Interest |
870.65 |
1,163.14 |
1,505.84 |
|
Total Equity |
4,604.25 |
5,354.47 |
6,285.51 |
|
|
|
|
|
|
Liabilities: |
|
|
|
|
Non-Current Liabilities: |
|
|
|
|
Financial Liabilities: |
|
|
|
|
Borrowings |
1.04 |
0.19 |
- |
|
Lease Liabilities |
- |
107.57 |
91.69 |
|
Other Financial Liabilities |
83.85 |
- |
- |
|
Provisions |
72.40 |
88.69 |
103.52 |
|
Deferred Tax Liabilities |
- |
- |
48.11 |
|
Total Non-Current Liabilities |
157.29 |
196.45 |
243.32 |
|
|
|
|
|
|
Current Liabilities: |
|
|
|
|
Financial Liabilities: |
|
|
|
|
Borrowings |
1,772.56 |
892.57 |
666.81 |
|
Lease Liabilities |
- |
29.22 |
30.29 |
|
Trade Payables: |
|
|
|
|
Total Outstanding Dues of Micro and Small Enterprises |
6.23 |
22.89 |
42.71 |
|
Other Creditors |
1,452.33 |
1,381.46 |
1,500.14 |
|
Other Financial Liabilities |
105.62 |
23.92 |
39.31 |
|
Other Current Liabilities |
300.58 |
307.08 |
375.69 |
|
Provisions |
10.00 |
14.09 |
17.07 |
|
Total Current Liabilities |
3,647.32 |
2,671.23 |
2,672.02 |
|
|
|
|
|
|
Total Equity & Liabilities |
8,408.86 |
8,222.15 |
9,200.85 |
TV18 Broadcast Limited - Cash Flow Statement (₹ in Crores)
|
|
Mar-20 |
Mar-21 |
Mar-22 |
|
Net Profit Before Tax |
501.72 |
703.39 |
1,016.29 |
|
Net Cash from Operating Activities |
152.81 |
1,318.71 |
593.08 |
|
Net Cash Used for Investing Activities |
-188.60 |
-98.88 |
-294.08 |
|
Net Cash From (Used For) Financing Activities |
-31.62 |
-1,008.41 |
-292.98 |
|
Net Increase in Cash and Cash Equivalents |
-67.41 |
211.42 |
6.02 |
|
Cash And Cash Equivalents at The Beginning of The Year |
178.95 |
113.62 |
325.25 |
|
Cash And Cash Equivalents at The End of the Year |
113.62 |
325.25 |
332.79 |
TV18 Broadcast Limited - Ratio Analysis
|
|
Mar-19 |
Mar-20 |
Mar-21 |
Mar-22 |
|
Profitability Ratio |
|
|
|
|
|
EBITDA Margin |
7.01% |
14.93% |
19.08% |
19.88% |
|
EBIT Margin |
4.35% |
11.78% |
16.04% |
17.86% |
|
Pre-Tax Margin |
3.05% |
9.54% |
15.43% |
18.14% |
|
Net Profit Margin |
4.23% |
7.93% |
16.35% |
16.54% |
|
|
|
|
|
|
|
Return on Investment |
|
|
|
|
|
Return on Asset – ROA |
2% |
3% |
5% |
7% |
|
Return on Capital Employed – ROCE |
5% |
13% |
14% |
17% |
|
Return on Equity – ROE |
4% |
6% |
9% |
10% |
|
|
|
|
|
|
|
Liquidity Ratio (x) |
|
|
|
|
|
Current ratio |
1.32 |
1.34 |
1.77 |
2.13 |
|
Quick Ratio |
0.76 |
0.79 |
1.07 |
1.16 |
|
|
|
|
|
|
|
|
|
|
|
|
|
Solvency Ratio |
|
|
|
|
|
Debt to Equity |
0.05 |
0.00 |
0.00 |
0.00 |
|
Interest Coverage Ratio |
2 |
4 |
8 |
26 |
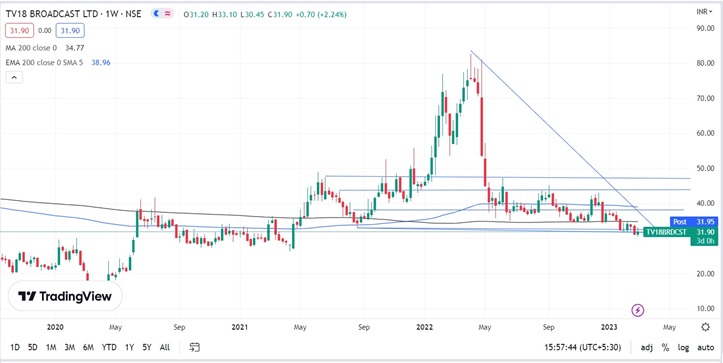
TV18 Broadcast Limited - Technical Analysis
-
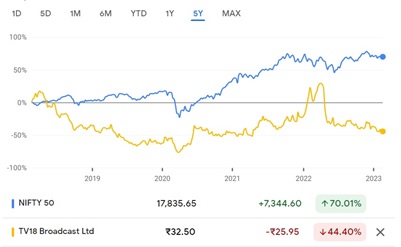
The stock has drastically fallen from its 52-week from ₹82.60 to ₹30.45 in the last nine months, the reason for such a drastic fall was the impact on the profit margins of the company.
-
Stock is trading below the Moving Average 200 Days with a support level of ₹30 and a resistance level of ₹43.
-
Stock is on a downward trend on the weekly and Monthly chart.
-
With improvement in revenue and profitability of the company in the coming quarters, the current market price of the stock tends to improve.
Recommendation Rationale
-
Continuous growth in operating revenues:
-
TV18 reported an increase in its consolidated total operating income (TOI) of almost 23% during FY22, principally due to a significant improvement in the advertising revenues from the TV news and entertainment divisions as well as a rebound in the film industry. A higher PBT margin of 18.82% was reported by the corporation as a result of ongoing cost management. Also, on a year-over-year basis, the revenue increased by almost 13% in Q3FY23. The profitability margins, however, decreased during Q3FY23 due to higher operating costs, which were boosted by higher content and marketing expenditures in GEC, sports, and digital businesses, as well as higher employee costs, which were boosted by ramping-up staff to support the expansion of operations.
-
-
Improvement in Revenue and Profit Margin in the medium term:
-
As TV18's digital rights to live stream IPL matches are monetized, we anticipate that its consolidated Total Operating Profit will grow dramatically. For a more comfortable watching experience for customers, the business intends to combine VOOT and Jio Cinema applications into a single OTT app. Moreover, it intends to use the sizable customer base of the RIL group's telecom company to boost sales.
-
-
Strategic alliance with Bodhi Tree Systems (BTS):
-
One of India's leading media and entertainment conglomerates, the Network18 group (of which TV18 is a member), consistently ranks in the top three in the majority of the important industries it serves. Since it is essential to the continued expansion of the group's media and entertainment-related companies, the Network18 group—the RIL group's principal investment in the media and entertainment sector—is a strategically significant business for the company.
-
This is demonstrated by its recently announced strategic partnership with BTS, in which RIL (through its wholly owned subsidiary) planned an equity infusion of ₹1,645 crores in cash and contributed the Jio Cinema app to VMPL (a subsidiary of TV18) to expand its operations and become one of the largest TV and digital streaming companies.
-
BTS is anticipated to spend $13,500 crore in VMPL as part of this deal. The required permissions must be given before the deal may proceed.
-
-
Dominant position in business news as well as niche entertainment genres:
-
In India, TV18 owns and runs a sizable network of 60 channels that includes both news and entertainment. Via its 20 overseas beams, it also serves the Indian audience across the world. The TV18 (standalone) news division contains stations that dominate their respective markets in the Hindi (News18 India), English General News (CNN News18), and English Business News (CNBC TV18) categories, as well as a developing cluster of 14 Regional News networks (including joint venture [JV] News18-Lokmat).
-
During the seasons 2023 through 2027, VMPL purchased the exclusive rights in June 2022 to digitally stream the immensely popular IPL cricket matches in the Indian subcontinent.
-
-
The volatility of advertisement revenue:
-
The majority of TV18's overall revenues come from advertising and subscriptions. The market rivalry, television channel viewership, the calibre and appeal of broadcast content, media industry developments, regulatory changes, and the overall level of economic activity all affect how much money is made through advertisements.
-
Valuation
-
TV18 Broadcast Limited has shown revenue growth of 4% CAGR for FY2019-2022.
-
The company’s net profit has shown a growth of 52% CAGR for FY2018-2022.
-
The company’s ROE and ROCE are 10% & 17% for FY2022.
-
The company has low debt.
-
Impact on profit margin in Q3FY2022:
-
Operational expenses for the quarter rose by 60%, mostly as a result of distribution and content cost efforts. Because of the business's significant operating leverage, lower-than-expected advertising income has a direct impact on profitability. But, thanks to management’s investment in the company, strong viewing positions have been developed across the industry, which will be crucial in capturing growth as the need for advertising increases.
-
-
We anticipate the company could generate higher revenue for the following FY 2023, comparable to the prior year, based on the company's present performance in FY 2022.
-
We used data from the last five years (2018-2022) to anticipate revenue for the fiscal years 2023–2027.
Estimated Income Statement (₹ in crores)
|
|
Mar-23 |
Mar-24 |
Mar-25 |
Mar-26 |
Mar-27 |
|
2023-E |
2024-E |
2025-E |
2026-E |
2027-E |
|
|
Value Sales and Services |
6,753.28 |
7,090.28 |
7,444.11 |
7,815.59 |
8,205.61 |
|
Goods and Services Tax Included in Above |
-951.33 |
-998.80 |
-1,048.64 |
-1,100.97 |
-1,155.92 |
|
Other Income |
82.69 |
90.96 |
100.05 |
110.06 |
121.06 |
|
Total Income |
5,884.64 |
6,182.44 |
6,495.52 |
6,824.67 |
7,170.76 |
|
|
|
|
|
|
|
|
Operational Costs |
2,498.71 |
2,521.00 |
2,646.80 |
2,778.89 |
2,917.56 |
|
Marketing, Distribution and Promotional Expense |
1,283.12 |
1,173.38 |
1,231.93 |
1,293.41 |
1,357.95 |
|
Employee Benefits Expense |
1,148.06 |
1,109.47 |
1,164.84 |
1,222.96 |
1,283.99 |
|
Other Expenses |
405.20 |
362.99 |
381.10 |
400.12 |
420.09 |
|
EBITDA |
549.55 |
1,015.60 |
1,070.84 |
1,129.29 |
1,191.16 |
|
|
|
|
|
|
|
|
Depreciation and Amortisation Expense |
111.06 |
122.71 |
133.34 |
143.31 |
152.92 |
|
EBIT |
438.49 |
892.89 |
937.50 |
985.97 |
1,038.24 |
|
|
|
|
|
|
|
|
Finance Costs |
175.40 |
267.87 |
281.25 |
295.79 |
311.47 |
|
EBT before share of Profit/(Loss) of Associates and Joint Ventures |
263.09 |
625.02 |
656.25 |
690.18 |
726.77 |
|
|
|
|
|
|
|
|
Share of Profit/(Loss) of Associates and Joint Ventures |
5.26 |
12.50 |
13.12 |
13.80 |
14.54 |
|
EBT |
268.36 |
637.52 |
669.37 |
703.99 |
741.30 |
|
|
|
|
|
|
|
|
Tax Expense |
67.09 |
159.38 |
167.34 |
176.00 |
185.33 |
|
PAT before Non-Controlling |
201.27 |
478.14 |
502.03 |
527.99 |
555.98 |
|
|
|
|
|
|
|
|
Non-Controlling |
-74.26 |
-176.41 |
-185.23 |
-194.80 |
-205.13 |
|
PAT |
127.01 |
301.73 |
316.80 |
333.19 |
350.85 |
Disclaimer: This report is only for the information of our customer Recommendations, opinions, or suggestions are given with the understanding that readers acting on this information assume all risks involved. The information provided herein is not to be construed as an offer to buy or sell securities of any kind.
- Share :


Post a Comment
|
DISCLAIMER |
This report is only for the information of our customers. Recommendations, opinions, or suggestions are given with the understanding that readers acting on this information assume all risks involved. The information provided herein is not to be construed as an offer to buy or sell securities of any kind. ATS and/or its group companies do not as assume any responsibility or liability resulting from the use of such information.