V-Mart Retail
V-Mart Retail Limited - Background
V-Mart Retail Limited is an India-based company that retails readymade garments and accessories. The Company is engaged in the business of value retailing through the chain of stores situated at various places in India. It offers products across three verticals, which include apparel, general merchandise and kirana bazaar. It provides a range of apparels and accessories for men, women, boys, girls and infants. Its general merchandise includes non-apparel division and home mart division. Its non-apparel division offers products, such as footwear, books and stationery, toys and games, purses and clutches, fashion jewelry, bags and luggage. Its home mart division offers products, including home furnishing, kitchenware, crockery, gifts and novelties. The Company also offers fast-moving consumer goods products, packaged food items, beauty and personal care, homecare and staples. Source: Reuters
|
BSE Code |
534976 |
|
NSE Code |
VMART |
|
Reuters Code |
VMAR.NS |
|
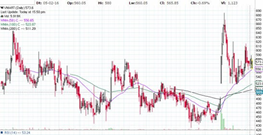
CMP (as on 09/02/2016) |
556.00 |
|
Stock Beta |
0.29 |
|
52 Week H/L |
682.80/429.40 |
|
Market Cap (Cr) |
1003.84 |
|
Equity Capital (Rs cr) |
18.02 |
|
Face Value (Rs) |
10 |
|
Average Volume |
2438 |
|
|
|
|
Shareholding Pattern (%) |
|
|
Promoters |
57.18 |
|
Non Institutions |
42.82 |
|
Grand Total |
100 |
V-Mart Retail Limited - Investment Rationale
-
Significant presence
-
Low competition and expansion plans
-
Consistent growth and sound financials
-
Growth prospects of the economy
-
Effective business model
V-Mart Retail Limited - Risks and Concerns
-
Competition from the unorganized sector
-
Dependence on agriculture output
-
Cost fluctuations
Conclusion & Recommendation
VRL is a dominant player in domestic retail and general merchandise its high-quality products and wide market reach. With aggressive expansion plans, favorable demographics, and growth opportunities we expect the company to outperform the industry in the both medium-term and long-term future.
At the current market price of Rs.556 the stock is trading at ~14x FY17E EPS. Investors could buy the stock at CMP and add on dips to around Rs.520 to Rs.510 levels (~13x FY17E EPS) for our sequential targets of Rs.670 and Rs.740 (~17x to ~19x FY17E EPS).
V-Mart Retail Limited - Financial Summary
|
Particulars (Rs. in Crs) |
FY2013 |
FY2014 |
FY2015 |
FY2016 |
2017E |
|
Net Sales |
383.08 |
574.11 |
718.98 |
865.53 |
1064.07 |
|
Operating Profit |
39.97 |
52.96 |
64.82 |
81.42 |
105.27 |
|
PAT |
18.00 |
25.16 |
38.57 |
48.63 |
70.62 |
|
EPS (Rs.) |
9.99 |
13.96 |
21.40 |
26.99 |
39.19 |
|
PE (x) |
55.66 |
39.82 |
25.98 |
20.60 |
14.19 |
V-Mart Retail Limited - Business Profile
Product Overview
Its business is spread across three departments – apparel, general merchandise (non-apparel and home mart) and kirana bazaar. The Company offers customers a range of products at reasonable prices, emerging as a destination-of-choice in tier-II and tier-III locations of the country. The Company caters to the aspiring middle-class population, targeting the fashion-led aspirations of the youth and young families.
1).Apparel and Accessories
The Company provides a wide range of apparels and accessories for men, women, boys, girls and infants.
-
V-MART PLUS: V-Mart Plus caters to all age groups and serves the basic as well as discretionary needs of customers. Since these stores serve customers of all age groups and sections of the society, the Company stocks merchandise accordingly.
-
V-MART CORPORATE: V-Mart Corporate targets office-goers (both male and female) and the product line has been internally termed as Gold Line Fashion. These stores are located in areas where the population mostly comprises working professionals.
-
V-MART VALUES: V-Mart Values caters to all age groups and focuses on cost-competitive but quality products, keeping in mind the economic profile of the inhabitants of the region.
2).General merchandise
-
Non-apparel division: Footwear, books and stationery, toys and games, purses and clutches, fashion jewellery, bags and luggage.
-
Home mart division: Home furnishing, kitchenware, crockery, gifts and novelties
3).Kirana bazaar
FMCG products, packaged food items, beauty and personal care, homecare and staples.
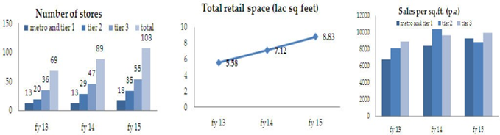
V-Mart Retail has 119 stores across 100 cities in 14 States and Union Territories, with a total retail area of approx 9.48 lac square feet. The stores are located in prime States such as Bihar, Chandigarh, Gujarat, Haryana, Jammu and Kashmir, Madhya Pradesh, New Delhi, Punjab, Rajasthan, Uttarakhand and Uttar Pradesh.
Investment Rationales
Significant presence
V-Mart Retail has presence across diverse verticals (apparels, general merchandise and kirana bazaar – FMCG products, packaged food items, beauty and personal care, home care, staple products) has helped diversify revenues and strengthen de-risking. It has 119 spread across 14 different states with ~9.7 lakh sq ft floor space, especially in Utter Pradesh and Bihar where it has a significant market share in semi urban tier 2 and tier 3 cities. This significant presence will give VRL an opportunity to capitalize on the demands and market potential of these where there is not much competition from organized retail players.
Low competition and expansion plans
Majority of VRL’s 119 outlets is in Tier 1 and Tier 2 cities where the other big organized retailers such as Lifestyle, Shoppers Stop, Trent, or Reliance Retail are not expected to open a store in net 3-5 years. It also plans to open 20-25 store of the size of 8000 square feet with a capex of around Rs 1.2-1.3 crores (Rs.1400/square feet with an average store size of 8000 square feet) for each store in different locations in the coming years. This will help VRL to capitalize on the available market opportunity to the maximum.
Consistent growth and sound financials
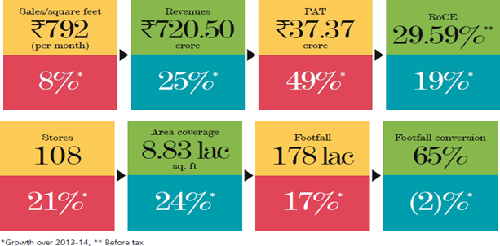
V-Mart Retail reported a 49% increase in PAT and a 25% increase in EBITDA in 2014-15, both being among the highest within its industry. It generated an average 178 lakhs footfalls per month during FY14-15 compared to an average of 151.7 lakhs in FY13-14, growing at a CAGR of 22% from FY10-11 to FY14-15. Revenue per square feet per month was almost 8% higher in FY14-15 compared to FY13-14. It has a very low debt of Rs.49 crores.
Growth prospects of the economy
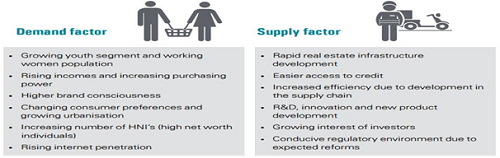
India is the fifth largest preferred retail destination globally. The sector is experiencing exponential growth, with retail development taking place not just in the metros, but also in the Tier-II and Tier-III locations. Healthy economic growth, changing demographic profiles, increasing disposable incomes, changing consumer tastes and preferences and increasing media penetration are other factors driving growth in the organised retail segment in India. India’s price-competitiveness attracts large retail players to use it as a sourcing base. India had over 13 million retail outlets in 2014 – the highest in the world. It also has the highest number of outlets (11,903) per million inhabitants. An increase in the young working population, especially women, with rising incomes and increasing purchasing power fuel the sector. Consumer expenditure is estimated to be US$3.6 trillion by 2020 vis-à-vis US$977 billion in 2010, at a CAGR of 13.9%. By 2020, average household income will increase three times to $18,448 from $6393 in 2010. Moreover, urbanisation will increase to 40% from 31% and over 200 million households will be nuclear, representing a 25-50% higher consumption per capita spend. Also, attitudinal shifts will be seen as majority of the young and working population economy started opening and hence will have higher consumption levels. Sales per square foot at Indian retail stores at Rs.1,500-2,000 per square foot is much lower than the international average of Rs.8,000-12,000 per sq.ft provides good headroom for the growth for VRL.
Effective business model
VRL’s set up an outlet by dividing the geographies based on cluster ie 100-175kms based on population, income levels, and competition. This helps to make optimum capitalization of market potential. It has an inventory holding period of 82 days and payable days of 45 days. It also helps the company to reduce the inventory holding for a store as less as~2cr on average. And it takes 45-50 days to reach break-even when VRL opens a new store, mainly because it opens a store in festive or marriage seasons. VRL sells its products ~40% less the price when compared o its peers keeping the product quality the same. The company has not opened any new stores for Kirana bazaar since 2012 as it has been reducing this segment to focus more on the fashion segment. Those Kirana stores which are not doing that good are being closed down and FMCG products generally have a low price point and a very low average selling point, so any reduction in these items affects the revenue. The contribution of Kirana to total revenues has declined to around ~8% in the second quarter of the financial year 2016. As Kirana stores has very less revenue margin of ~18% when compared ~35% in garments and allied business.
Governmental initiatives
The textile industry has recommended the government to levy GST on ex-factory price, which is always much lower than the MRP, as it would leave some legroom for periodic discount offers. The textile industry offers heavy discounts on MRP of branded garments not only in their factory outlets but also in organized retails to attract business. Especially in the lean season, even branded garments are available at affordable prices, which otherwise remain unaffordable for the average middle class. Considering expenses incurred on branding, transportation, and a host of other aspects, it is important to have a GST levy on ex-factory, which would be determined on the basis of actual manufacturing cost. Rentals of retailing industry and it attract service tax at 10%. Currently, the retailers cannot set off these costs like the other industries. This they feel is an additional cost of operating in this industry which is unfair to them. Under GST, taxes on services would be available for set off against taxes on goods. Thus, the retailer would be positively impacted. Increasing the FII limit to 49% will further boost the growth prospects of the company.
Industry Overview
The Indian retail industry has emerged as one of the most dynamic and fast-paced industries due to the entry of several new players. It accounts for over 10 percent of the country’s Gross Domestic Product (GDP) and around 8 percent of the employment. India is the world’s fifth-largest global destination in the retail space.
Market Size
The Boston Consulting Group and Retailers Association of India published a report titled, ‘Retail 2020: Retrospect, Reinvent, Rewrite’, highlighting that India’s retail market is expected to nearly double to US$ 1 trillion by 2020 from US$ 600 billion in 2015, driven by income growth, urbanization, and attitudinal shifts. The report adds that while the overall retail market is expected to grow at 12 percent per annum, modern trade would expand twice as fast at 20 percent per annum and traditional trade at 10 percent. Retail spending in the top seven Indian cities amounted to Rs 3.58 trillion (US$ 53.7 billion), with organized retail penetration at 19 percent as of 2014. Online retail is expected to be at par with the physical stores in the next five years.
India is expected to become the world’s fastest-growing e-commerce market, driven by robust investment in the sector and a rapid increase in the number of internet users. Various agencies have high expectations about the growth of Indian e-commerce markets. Indian e-commerce sales are expected to reach US$ 55 billion! by FY2018 from US$ 14 billion in FY2015. Further, India's e-commerce market is expected to reach US$ 220 billion in terms of the gross merchandise value (GMV) and 530 million shoppers by 2025, led by faster speeds on reliable telecom networks, faster adoption of online services, and better variety as well as convenience@. India’s direct selling industry increased 6.5 percent in FY2014-15 to Rs 7,958 crore (US$ 1.19 billion) and is expected to reach a size of Rs 23,654 crore (US$ 3.55 billion) by FY2019-20, as per a joint report by India Direct Selling Association (IDSA) and PHD.
Finance and Assistance
The Indian retail sector accounts for 22 percent of the country's gross domestic product (GDP) and contributes to 8 percent of the total employment. India continues to be among the most attractive investment propositions for global retailers. Cumulative foreign direct investment (FDI) inflows in single-brand retail trading, from April 2000 to June 2011, stood at US$ 69.26 million. Till now FDI up to 100 percent was allowed for cash and carry wholesale trading and export trading under the automatic route, and FDI up to 51 percent was allowed in single-brand products, with prior government approvals. However, the Government recently passed a cabinet note and permitted FDI up to 51% in multibrand retailing with prior Government approval and 100% in single-brand retailing thus further liberalizing the sector. This policy initiative is expected to provide further fillip to the growth of the sector.
Market Dynamics
In the past few years, the Indian Retail sector has seen tremendous growth in the organized segment. Major domestic players have stepped into the retail arena with long-term, ambitious plans to expand their business across verticals, cities, and formats. Companies like Tata, Reliance, Adani Enterprise and Bharti have been investing considerably in the booming Indian retail market. Along with these giant retailers, a number of transnational brands have also entered into the market to set up retail chains in close association with bigger Indian companies.
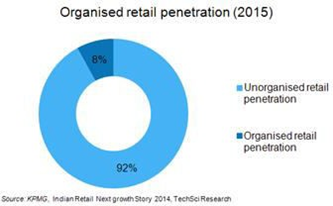
High consumer spending over the years by the young population (more than 31% of the country is below 14 years) and a sharp rise in disposable income are driving the Indian organized retail sector’s growth. Even Tier I & Tier II cities and towns are witnessing a major shift in consumer preferences and lifestyles, the result of which, they have emerged as attractive markets for retailers to expand their presence. The Indian retail sector is highly fragmented and the unorganized sector has around 13 million retail outlets that account for around 95-96% of the total Indian retail industry. However, going forward, the organized sector’s growth potential is expected to increase due to globalization, high economic growth, and improved lifestyle.
Although the growth potential in the sector is immense, there are obstacles too, that could slow the pace of growth for new entrants. Rigid regulations, high personnel costs, real estate costs, lack of basic infrastructure, and highly competitive domestic retailer groups are some of such challenges.
Emerging sectors/trends in Indian retailing
Within retail, the emerging sectors would be food and grocery, apparel, electronics, e-commerce, fashion, and lifestyle. The incorporation of technology in the organized retail segment has been something to reckon with in the past few years. The use of computers for merchandise planning and management, control of inventory costs and supplies, and replenishment of goods done electronically, internal store billing, etc have changed the face of product retailing.
Online retail business is the next-gen format that has a high potential for growth in the near future. After conquering physical stores, retailers are now foraying into the domain of e-retailing. The retail industry is all set to test waters over the online medium, by selling products through websites. Food and grocery stores comprise the largest chunk of the Indian retail market. An emerging trend in this segment is the virtual formats where customer orders are taken online through web portals which are delivered at the doorstep the very same day or the following day. This trend has been catching up with most of the large-sized retail chains that have their websites.
Risks and Concerns
Competition from unorganized sector
There are large number unorganized players in textile and retail industry delivering products at different standards. VRL is exposed to high completion from these players in all the markets it operates in.
Dependence on agriculture output
V-Mart Retail operates mostly in those markets where agriculture is the key source of income. The increase or decrease in rainfall or decrease in agriculture output will affect the sales in a negative manner.
Cost fluctuations
Increase in labor cost or lease rent expenses constitutes majority of operating expenses of VRL. Increase in these expenses can affect profitability.
Financials
Quarterly financial review
-
The standalone total income from operations of Rs 161.76 crore and a net profit of Rs 0.95 crore for the quarter ended Sep '15. Other income for the quarter was Rs 0.29 crore.
-
For the quarter ended Sep 2014 the standalone total income from operations was Rs 144.56 crore and net profit was Rs 2.71 crore, and other income Rs 0.28 crore.
-
It’s standalone core operating profit at Rs. 5.75 crore, was up by 13.86% yoy, but declined by 13.86% qoq. Operating margin stood at 3.55% expanded by 6 bps yoy, but declined 674 bps qoq.
-
For six months ended September 30, 2015, the company’s standalone net profit at Rs. 12.13 crore, up by 3.32% yoy. The company's revenue stood at Rs. 366.21 crore, registering growth 18.29% yoy.
Q2FY16
|
|
2nd Qtr201509 |
2nd Qtr201409 |
VAR [%] |
2nd Qtr201509 |
1st Qtr201506 |
VAR [%] |
|
Gross Sales |
161.47 |
144.28 |
11.9 |
161.47 |
204.28 |
-21.0 |
|
Excise Duty |
0 |
0 |
0 |
0 |
0 |
0 |
|
Net Sales |
161.47 |
144.28 |
11.9 |
161.47 |
204.28 |
-21.0 |
|
Other Operating Income |
0.29 |
0.28 |
3.6 |
0.29 |
0.19 |
52.6 |
|
Other Income |
0.14 |
0.48 |
-70.8 |
0.14 |
0.65 |
-78.5 |
|
Total Income |
161.89 |
145.04 |
11.6 |
161.89 |
205.11 |
-21.1 |
|
Total Expenditure |
156 |
140.59 |
11 |
156 |
183.57 |
-15.0 |
|
PBIDT |
5.9 |
4.45 |
32.6 |
5.9 |
21.54 |
-72.6 |
|
Interest |
0.64 |
1.07 |
-40.2 |
0.64 |
0.5 |
28.0 |
|
PBDT |
5.26 |
3.38 |
55.6 |
5.26 |
21.04 |
-75.0 |
|
Depreciation |
3.95 |
-1.14 |
446.5 |
3.95 |
4.02 |
-1.7 |
|
PBT |
1.31 |
4.52 |
-71 |
1.31 |
17.02 |
-92.3 |
|
Tax |
0.36 |
1.81 |
-80.1 |
0.36 |
5.83 |
-93.8 |
|
Reported Profit After Tax |
0.95 |
2.71 |
-64.9 |
0.95 |
11.19 |
-91.5 |
|
Adj Pro After Extra-ordinary item |
0.95 |
3.8 |
-75 |
0.95 |
11.19 |
-91.5 |
|
|
|
|
|
|
|
|
|
PBIDTM(%) |
3.65 |
3.08 |
18.5 |
3.65 |
10.54 |
-65.4 |
|
PBDTM(%) |
3.26 |
2.34 |
39.3 |
3.26 |
10.3 |
-68.3 |
|
PATM(%) |
0.59 |
1.88 |
-68.6 |
0.59 |
5.48 |
-89.2 |
Profit and Loss Account as per rough estimates
|
|
FY13 |
FY14 |
FY15 |
FY16E |
FY17E |
|
Gross Sales |
383.08 |
574.11 |
718.98 |
865.53 |
1064.07 |
|
Excise Duty |
0 |
0 |
0 |
0 |
0 |
|
Net Sales |
383.08 |
574.11 |
718.98 |
865.53 |
1064.07 |
|
Other Operating Income |
0.38 |
0.85 |
1.22 |
1.21 |
1.36 |
|
Other Income |
0.83 |
0.71 |
2.28 |
2.32 |
2.83 |
|
Total Income |
384.28 |
575.67 |
722.47 |
869.06 |
1068.26 |
|
Total Expenditure |
344.31 |
522.71 |
657.65 |
787.63 |
962.99 |
|
PBIDT |
39.97 |
52.96 |
64.82 |
81.42 |
105.27 |
|
Interest |
5.75 |
4.24 |
4.31 |
4.05 |
3.67 |
|
PBDT |
34.23 |
48.72 |
60.51 |
77.37 |
101.61 |
|
Depreciation |
7.62 |
10.89 |
4.57 |
7.10 |
7.05 |
|
PBT |
26.61 |
37.82 |
55.95 |
70.27 |
94.56 |
|
Tax |
8.6 |
12.67 |
18.58 |
21.64 |
23.94 |
|
Reported Profit After Tax |
18 |
25.16 |
37.37 |
48.63 |
70.62 |
|
Adjusted Profit After Extra-ordinary item |
18 |
25.16 |
38.57 |
48.63 |
70.62 |
Balance Sheet as per rough estimates
|
|
FY13 |
FY14 |
FY15 |
FY16E |
FY17E |
|
SOURCES OF FUNDS: |
|
|
|
|
|
|
Share Capital |
17.96 |
17.96 |
18.02 |
18.02 |
18.02 |
|
Reserves & Surplus |
129.69 |
152.2 |
186.92 |
228.92 |
291.92 |
|
Loan Funds |
35.02 |
43.52 |
30.15 |
31.36 |
29.37 |
|
Other Liabilities |
1.03 |
3.09 |
6.44 |
7.63 |
9.56 |
|
Total Liabilities |
183.7 |
216.76 |
241.53 |
285.93 |
348.86 |
|
APPLICATION OF FUNDS: |
|
|
|
|
|
|
Fixed Assets |
48.75 |
70.97 |
98.79 |
117.11 |
138.66 |
|
Investments |
40.64 |
34.24 |
21.8 |
27.65 |
32.45 |
|
Current Assets, Loans & Advances |
131 |
173.37 |
191.93 |
230.50 |
277.52 |
|
Inventories |
110.75 |
167.7 |
183.2 |
221.29 |
268.56 |
|
Cash & Bank Balance |
15.77 |
2.32 |
3.36 |
3.55 |
2.63 |
|
Other Current Assets |
0.04 |
0.02 |
0.07 |
0.05 |
0.05 |
|
Loans & Advances |
4.43 |
3.33 |
5.31 |
5.61 |
6.27 |
|
Current Liabilities & Provisions |
46.05 |
76.84 |
87.43 |
109.66 |
123.45 |
|
Current Liabilities |
44.37 |
72.25 |
82.13 |
103.07 |
116.58 |
|
Provisions |
1.68 |
4.59 |
5.3 |
6.60 |
6.88 |
|
Net Current Assets |
84.94 |
96.53 |
104.5 |
120.84 |
154.06 |
|
Deferred Tax Assets |
0.73 |
2.17 |
0.64 |
1.41 |
1.55 |
|
Other Assets |
8.64 |
12.86 |
15.8 |
18.93 |
22.11 |
|
Total Assets |
183.7 |
216.76 |
241.53 |
285.93 |
348.84 |
Conclusion and Recommendation
We are positive on VRL over the long term and hence recommend a BUY at CMP of RS.556.00 and further add on declines between Rs.520 to Rs.510 for a target of Rs.670 to Rs.740 with stop loss maintained at Rs.510.
- Share :


Post a Comment
|
DISCLAIMER |
This report is only for the information of our customers. Recommendations, opinions, or suggestions are given with the understanding that readers acting on this information assume all risks involved. The information provided herein is not to be construed as an offer to buy or sell securities of any kind. ATS and/or its group companies do not as assume any responsibility or liability resulting from the use of such information.