VAKRANGEE LIMITED
Vakrangee Limited - Company Overview
Vakrangee Limited, formerly Vakrangee Softwares Limited, is an India-based e-Governance company. The company leverages its vast network of retail access points to deliver real-time BFSI services, government-to-citizen services and business-to-consumer services to the unserved rural, semi-urban and urban markets. The company was founded on May 28, 1990 and is headquartered in Mumbai, India.
The Company’s business is divided into two business segments: e-Governance business, including systems integration projects and print and data management services, and Vakrangee Mart Business, which includes financial inclusion business, government-to-citizen (G2C) and business-to-consumer (B2C) services and white label automated teller machine (ATM) business. The e-Governance business segment provides system integration and other services for India’s national e-Governance plans including unique identification (UID) enrollment, sarva shiksha abhiyan, public distribution system, rashtriya swasthya bima yojana, inspector general of registration and controller of stamps (IGRS), and print and data management services and election related projects. The Vakrangee Mart business segment consists of financial inclusion business, G2C/B2C business as well as white label ATMs (WLA) business.
The current market capitalization stands at Rs 6,243.18 crore.The company has reported a consolidated sales of Rs 702.16 crore and a Net Profit of Rs 89.34 crore for the quarter ended Dec 2014.
Vakrangee Limited - Share Holding Pattern
|
Category |
No. of Shares |
Percentage |
|
Promoters |
195,176,514 |
38.77 |
|
Other Companies |
176,375,017 |
35.03 |
|
General Public |
78,552,668 |
15.60 |
|
Financial Institutions |
29,423,155 |
5.84 |
|
Foreign Institutions |
12,198,484 |
2.42 |
|
Foreign - NRI |
7,183,068 |
1.43 |
|
Others |
4,573,334 |
0.91 |
Vakrangee Limited - Financial Details
-
Market Cap (Rs Cr) – 6243.18
-
Company P/E – 23.16
-
Industry P/E – 25.60
-
Book Value (Rs) – 13.45
-
Dividend (%) – 25%
-
EPS (TTM) – 5.35
-
Dividend Yield (%) – 0.20%
-
Face Value (Rs) - 1
Industry Overview
India is the world's largest sourcing destination for the information technology (IT) industry, accounting for approximately 52 percent of the US$ 124-130 billion market. The industry employs about 10 million Indians and continues to contribute significantly to the social and economic transformation in the country.
The IT industry has not only transformed India's image on the global platform, but has also fuelled economic growth by energising the higher education sector especially in engineering and computer science. India's cost competitiveness in providing IT services, which is approximately 3-4 times cheaper than the US, continues to be its unique selling proposition (USP) in the global sourcing market.
The Indian IT and ITeS industry is divided into four major segments – IT services, business process management (BPM), software products and engineering services, and hardware. The IT-BPM sector in India grew at a compound annual growth rate (CAGR) of 25 percent over 2000-2013, which is 3-4 times higher than the global IT-BPM spend, and is estimated to expand at a CAGR of 9.5 percent to US$ 300 billion by 2020.
India continues to be the topmost off shoring destination for IT companies followed by China and Malaysia in second and third position, respectively. Emerging technologies present an entire new gamut of opportunities for IT firms in India. Social, mobility, analytics and cloud (SMAC) collectively provide a US$ 1 trillion opportunity. Cloud represents the largest opportunity under SMAC, increasing at a CAGR of approximately 30 percent to around US$ 650-700 billion by 2020. Social media is the second most lucrative segment for IT firms, offering a US$ 250 billion market opportunity by 2020.
The US$ 12 billion plus rising Indian e-commerce business market is witnessing a rush of hiring and may need 100,000 people over the next six months, as per industry experts. The industry offers a slew of opportunities and scope for innovation thereby attracting the young mind to push their limits.
Vakrangee Limited - Balance Sheet
|
|
Mar '14 |
Mar '13 |
Mar '12 |
Mar '11 |
Mar '10 |
|
Sources Of Funds |
|
|
|
|
|
|
Total Share Capital |
50.35 |
50.25 |
25.02 |
23.71 |
22.50 |
|
Equity Share Capital |
50.35 |
50.25 |
25.02 |
23.71 |
22.50 |
|
Share Application Money |
102.15 |
0.00 |
0.00 |
8.61 |
4.15 |
|
Reserves |
652.46 |
465.29 |
389.06 |
323.92 |
274.14 |
|
Networth |
804.96 |
515.54 |
414.08 |
356.24 |
300.79 |
|
Secured Loans |
392.60 |
415.24 |
353.28 |
148.89 |
57.01 |
|
Unsecured Loans |
0.00 |
0.00 |
10.93 |
4.00 |
4.50 |
|
Total Debt |
392.60 |
415.24 |
364.21 |
152.89 |
61.51 |
|
Total Liabilities |
1,197.56 |
930.78 |
778.29 |
509.13 |
362.30 |
|
Application Of Funds |
|
|
|
|
|
|
Gross Block |
996.46 |
799.80 |
711.77 |
352.23 |
317.65 |
|
Less: Accum. Depreciation |
561.48 |
381.42 |
224.65 |
137.32 |
86.86 |
|
Net Block |
434.98 |
418.38 |
487.12 |
214.91 |
230.79 |
|
Capital Work in Progress |
48.11 |
0.00 |
0.08 |
0.00 |
0.00 |
|
Investments |
3.76 |
11.67 |
58.37 |
60.06 |
53.12 |
|
Inventories |
130.61 |
19.86 |
3.59 |
0.90 |
7.77 |
|
Sundry Debtors |
791.96 |
661.37 |
445.24 |
269.86 |
142.25 |
|
Cash and Bank Balance |
29.21 |
31.22 |
25.97 |
8.80 |
0.67 |
|
Total Current Assets |
951.78 |
712.45 |
474.80 |
279.56 |
150.69 |
|
Loans and Advances |
289.36 |
216.58 |
75.01 |
95.44 |
20.93 |
|
Fixed Deposits |
0.00 |
0.00 |
0.00 |
9.37 |
3.57 |
|
Total CA, Loans & Advances |
1,241.14 |
929.03 |
549.81 |
384.37 |
175.19 |
|
Current Liabilities |
422.83 |
387.62 |
295.62 |
131.11 |
87.31 |
|
Provisions |
107.59 |
40.69 |
21.46 |
19.11 |
9.49 |
|
Total CL & Provisions |
530.42 |
428.31 |
317.08 |
150.22 |
96.80 |
|
Net Current Assets |
710.72 |
500.72 |
232.73 |
234.15 |
78.39 |
|
Total Assets |
1,197.57 |
930.77 |
778.30 |
509.12 |
362.30 |
|
Contingent Liabilities |
21.65 |
27.89 |
17.09 |
7.00 |
0.00 |
Vakrangee Limited - Profit and Loss Account
|
|
Mar '14 |
Mar '13 |
Mar '12 |
Mar '11 |
Mar '10 |
|
Income |
|
|
|
|
|
|
Sales Turnover |
1,965.39 |
1,555.78 |
1,352.14 |
852.34 |
409.35 |
|
Net Sales |
1,965.39 |
1,555.78 |
1,352.14 |
852.34 |
409.35 |
|
Other Income |
9.24 |
7.42 |
4.23 |
1.43 |
0.49 |
|
Stock Adjustments |
-11.63 |
16.10 |
1.08 |
0.00 |
0.00 |
|
Total Income |
1,963.00 |
1,579.30 |
1,357.45 |
853.77 |
409.84 |
|
Expenditure |
|
|
|
|
|
|
Power & Fuel Cost |
0.00 |
0.00 |
0.00 |
0.27 |
0.31 |
|
Employee Cost |
26.22 |
25.05 |
12.24 |
7.15 |
6.12 |
|
Other Manufacturing Expenses |
1,356.02 |
1,148.46 |
1,090.76 |
699.41 |
320.14 |
|
Selling and Admin Expenses |
0.00 |
0.00 |
0.00 |
8.13 |
4.17 |
|
Miscellaneous Expenses |
16.61 |
14.56 |
12.26 |
0.81 |
0.48 |
|
Total Expenses |
1,398.85 |
1,188.07 |
1,115.26 |
715.77 |
331.22 |
|
Operating Profit |
554.91 |
383.81 |
237.96 |
136.57 |
78.13 |
|
PBDIT |
564.15 |
391.23 |
242.19 |
138.00 |
78.62 |
|
Interest |
77.88 |
85.84 |
55.25 |
17.91 |
5.86 |
|
PBDT |
486.27 |
305.39 |
186.94 |
120.09 |
72.76 |
|
Depreciation |
180.32 |
156.94 |
87.40 |
53.30 |
40.61 |
|
Profit Before Tax |
305.95 |
148.45 |
99.54 |
66.79 |
32.15 |
|
PBT (Post Extra-ord Items) |
305.95 |
148.45 |
99.54 |
65.70 |
32.18 |
|
Tax |
106.96 |
39.18 |
32.04 |
17.63 |
8.04 |
|
Reported Net Profit |
199.00 |
109.27 |
67.51 |
49.17 |
24.11 |
|
Total Value Addition |
1,398.85 |
1,188.06 |
1,115.26 |
715.77 |
331.22 |
|
Equity Dividend |
12.59 |
10.05 |
10.01 |
4.99 |
3.37 |
|
Corporate Dividend Tax |
2.14 |
1.71 |
1.62 |
0.81 |
0.56 |
|
Per share data (annualised) |
|
|
|
|
|
|
Shares in issue (lakhs) |
5,034.82 |
5,024.99 |
2,502.40 |
237.12 |
224.96 |
|
Earning Per Share (Rs) |
3.95 |
2.17 |
2.70 |
20.74 |
10.72 |
|
Equity Dividend (%) |
25.00 |
20.00 |
20.00 |
20.00 |
15.00 |
|
Book Value (Rs) |
13.96 |
10.26 |
16.55 |
146.61 |
131.86 |
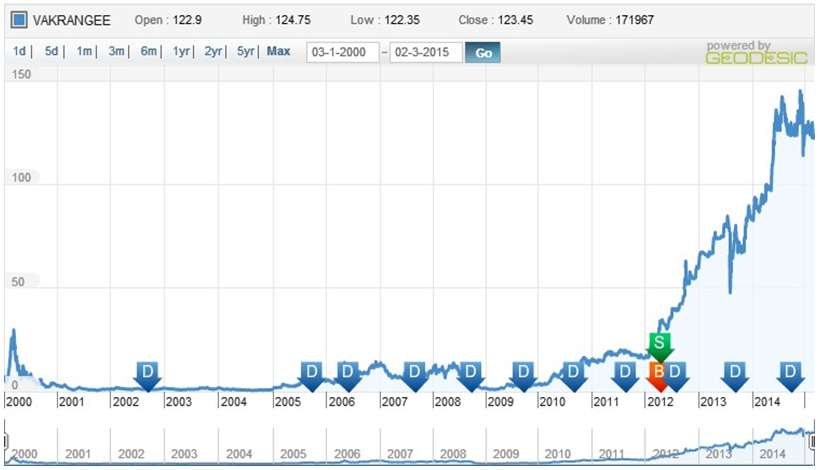
Dividend and Bonus History
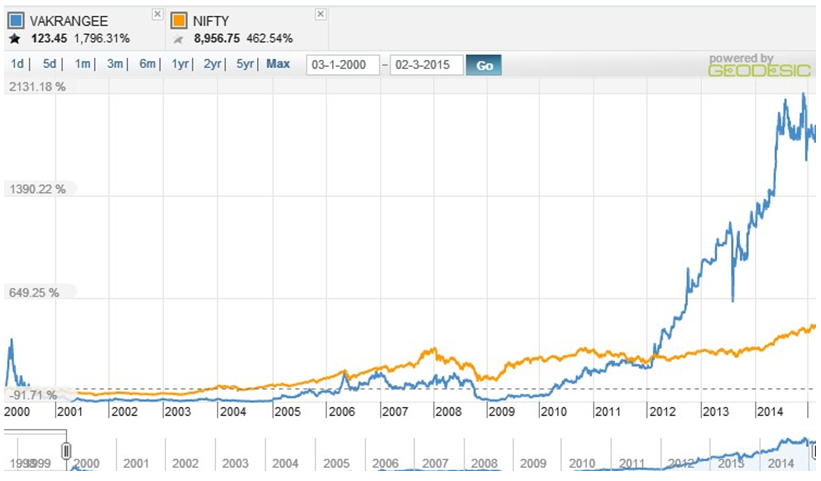
Index and Company Price Movement Comparison
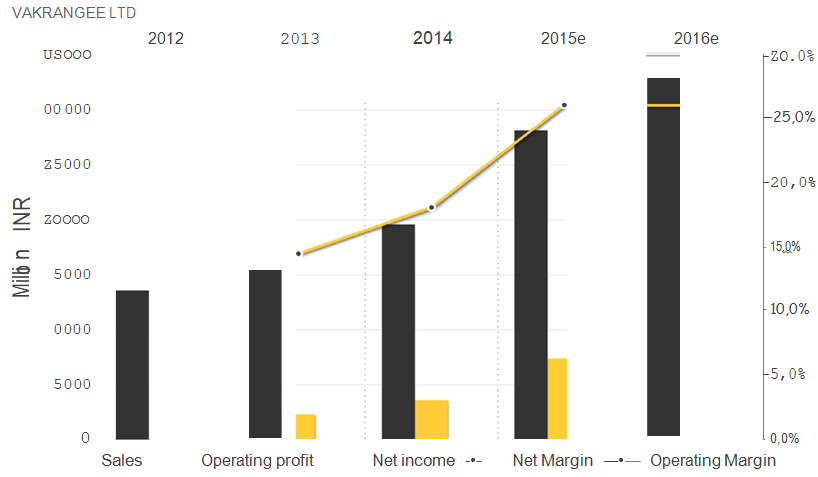
Company Forecast
Technical Indicators
|
Symbol |
Value |
Action |
|
RSI(14) |
82.105 |
Overbought |
|
STOCH(9,6) |
73.090 |
Buy |
|
STOCHRSI(14) |
60.404 |
Buy |
|
MACD(12,26) |
52.200 |
Buy |
|
ADX(14) |
71.773 |
Overbought |
|
Williams %R |
-22.809 |
Buy |
|
CCI(14) |
86.8763 |
Buy |
|
ATR(14) |
41.1536 |
High Volatility |
|
Highs/Lows(14) |
50.0500 |
Buy |
|
Ultimate Oscillator |
64.876 |
Buy |
|
ROC |
127.682 |
Buy |
|
Bull/Bear Power(13) |
82.2740 |
Buy |
Important Ratios
-
PBIT – 18.97 v/s 14.51
-
RoCE – 32.05 v/s 24.17
-
RoE – 22.50 v/s 20.30
-
Net Profit Margin – 10.07 v/s 6.99
-
Return on net worth – 28.31 v/s 21.19
-
D/E Ratio – 0.56 v/s 0.81
-
Interest Cover – 4.93 v/s 2.73
-
Current Ratio – 1.09 v/s 0.96
-
Reserves – 652.46 cr v/s 465.29 cr
-
PAT – 199.00 cr v/s 109.27 cr
-
Total assets – 1197.57 cr v/s 930.77 cr
-
Net sales – 1965.39 cr v/s 1555.78 cr
-
Book Value – 13.96 v/s 10.26
Simple Moving Average
|
Days |
BSE |
NSE |
|
30 |
126.03 |
126.09 |
|
50 |
125.10 |
125.09 |
|
150 |
129.28 |
129.29 |
|
200 |
128.12 |
128.13 |
Recommendations
Buy Vakrangee Ltd. at current or lower market levels
Reasons for the recommendations are :
-
Niche business and unique business model.
-
Attractive CAGR on both EBITA and Revenue.
-
MoU with leading market players and higher growth potential in rural and suburban India.
-
Attractive order book and licenses will guarantee profits.
-
Healthy financial position and attractive ratios.
-
Immense growth opportunity in e-governance service providing industry due to lack of linking of people with ATMs, Banks and other companies products.
- Share :


Post a Comment
|
DISCLAIMER |
This report is only for the information of our customers. Recommendations, opinions, or suggestions are given with the understanding that readers acting on this information assume all risks involved. The information provided herein is not to be construed as an offer to buy or sell securities of any kind. ATS and/or its group companies do not as assume any responsibility or liability resulting from the use of such information.