Voltas Limited Research Report
|
Market Price |
Recommendation |
Target |
Time Horizon |
|
858.45 |
Buy |
1035 |
1-Year |
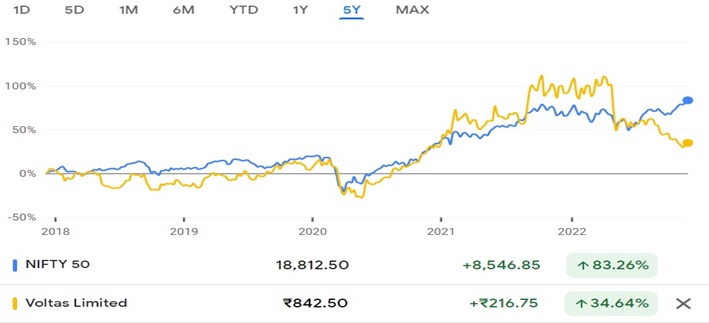
Voltas Limited - Q2FY2023 Review
Voltas Limited reported net revenue of ₹1,768.36 crores for the quarter ended September 30, 2022, compared to ₹1,689.08 crores for September 30, 2021. Profit After Tax was ₹13.44 crores for the quarter ended September 30, 2022, compared to ₹142.76 crores during the corresponding quarter of the previous year, respectively.
Voltas Limited - Investment Summary
|
CMP (₹) |
858.45 |
|
52 Week H/L |
803.60/1,347.65 |
|
Market Cap (crores) |
28,404 |
|
Face Value (₹) |
1.00 |
|
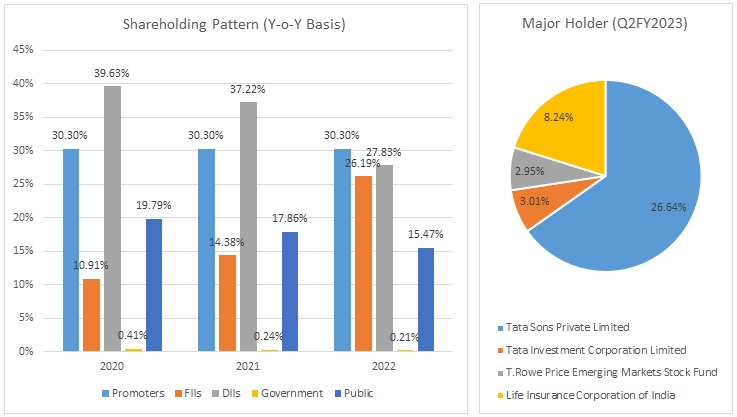
Promoter Holding (%) |
30.30 |
|
Non-Promoter Holding (%) |
69.70 |
|
Total (%) |
100.00 |
|
Book Value |
₹167.40 |
|
EPS TTM |
₹15.23 |
Voltas Limited - Overview
-
In order to develop, produce, market, and maintain medical refrigeration and vaccine storage equipment including Ice lined Refrigerators, Vaccine Freezers, and Ultra-low temperature Freezers for the Indian market, Voltas Limited, A Tata Enterprise and Vestfrost Solutions have entered into a Technology License Agreement as on 14, November 2022.
-
Through its Joint Venture in India and in equal partnership with Arcelik, Voltas recently debuted its line of Voltas Beko Home Appliances.
Beta: 0.80 |
Alpha: -4 |
Risk Reward Ratio: 1.96 |
Margin of Safety: 17% |
Voltas Limited - Quarterly Summary
|
Quarterly (INR in crores) |
Sep-22 |
Jun-22 |
Mar-22 |
Dec-21 |
Sep-21 |
|
Revenue from Operations |
1,768 |
2,768 |
2,667 |
1,794 |
1,689 |
|
Other income |
64.38 |
26.75 |
37.2 |
28.75 |
48.27 |
|
Total Income |
1,833 |
2,795 |
2,704 |
1,822 |
1,737 |
|
|
|
|
|
|
|
|
Total Expenditure |
1677.22 |
2599.5 |
2415.02 |
1647.65 |
1569.46 |
|
EBIT |
155.52 |
195.25 |
288.76 |
174.69 |
167.89 |
|
|
|
|
|
|
|
|
Finance cost |
6.74 |
3.98 |
12.51 |
3.62 |
6.24 |
|
EBT before Exceptional Items and share of Profit of Associate |
148.78 |
191.27 |
276.25 |
171.07 |
161.65 |
|
|
|
|
|
|
|
|
Share of Profit of Associate |
-28.91 |
-30.95 |
-28.85 |
-32 |
-18.89 |
|
EBT before Exceptional Items |
119.87 |
160.32 |
247.40 |
139.07 |
142.76 |
|
|
|
|
|
|
|
|
Exceptional Items |
-106.43 |
0 |
0 |
0 |
3.62 |
|
PBT |
13.44 |
160.32 |
247.40 |
139.07 |
146.38 |
|
|
|
|
|
|
|
|
Tax Expenses |
19.48 |
50.8 |
64.69 |
42.51 |
38.47 |
|
PAT |
-6.04 |
109.52 |
182.71 |
96.56 |
107.91 |
Business
-
A leading provider of engineering solutions, Voltas Limited specialises in projects and offers air conditioning solutions.
-
Voltas Limited, a Tata Group company that was established in India in 1954, offers a variety of goods in addition to room air conditioners, including air coolers, air purifiers, water dispensers, water coolers, commercial refrigeration, and commercial air conditioning.
-
With a reach of more than 25,000+ consumer touchpoints, Voltas, one of the top businesses in the Tata group, is the undisputed market leader in room air conditioners in India.
-
Voltas operates in three main business segments:
-
Electro-Mechanical Projects and Services (EMPS):
-
The EMPS business offers technical solutions for MEP projects, HVAC applications, central air conditioning and refrigeration, and water management services in domestic and international markets.
-
-
Unitary Cooling Products for Comfort and Commercial use (UPBG):
-
The UPBG business markets ACs, air coolers, water coolers, and other commercial refrigeration products.
-
-
Engineering Products and Services (EPBG):
-
The EPBG business markets and trades in mining and construction equipment as well as textile machinery, besides providing after-sales services.
-
-
-
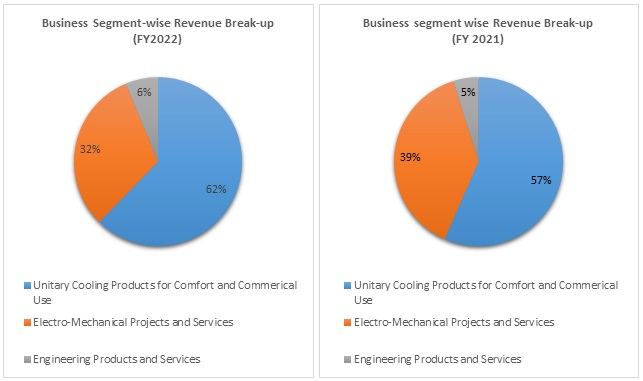
Out of the total revenue, 62% has been generated from Unitary Cooling Products for Comfort and Commercial use, 32% from Electro-Mechanical Projects and Services, and 6% from Engineering Products and Services in FY 2022 compared to 57%, 39%, and 5% in FY 2021, respectively.
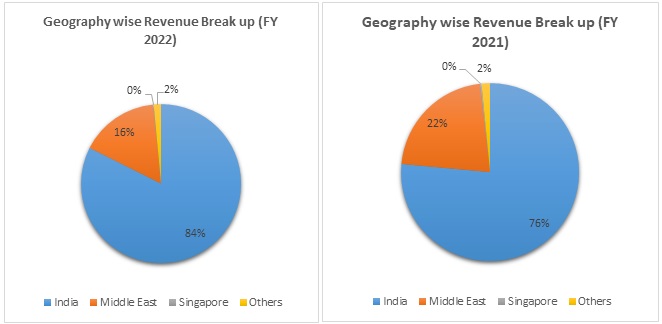
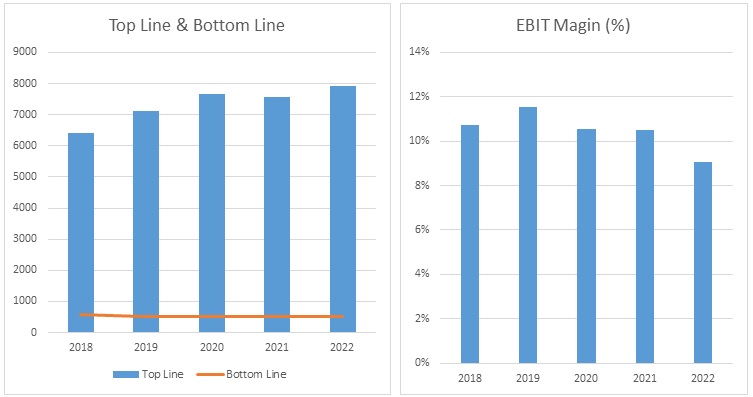
Voltas Limited - Revenue Trend
-
Geographically contribution from India was 84%, from the Middle East was 16%, from Singapore was 0%, and from Others, 2% in FY 2022 compared to 76%, 22%, 0%, and 2% in FY 2021, respectively.
Voltas Limited - SWOT ANALYSIS
-
Strength
-
Leader in terms of market share in cooling products segment.
-
Strong financial profile.
-
Diversified revenue stream
-
Strong market presence.
-
-
Weakness
-
MFs have decreased their shareholding.
-
Insufficient use of shareholder funds.
-
Trading around a 52-week low.
-
Insufficient use of assets to generate profits.
-
-
Opportunity
-
Improvement in construction activity.
-
PLI scheme will help the company to boost the Make-in-India moment.
-
Low penetration in India’s AC industry implies huge potential growth.
-
-
Threat
-
Sluggish economy and exchange rate fluctuations.
-
An increase in the prices of raw materials could impact the profit of the company.
-
Increase in competition.
-
Voltas Limited - Ratio Analysis
|
|
Mar-19 |
Mar-20 |
Mar-21 |
Mar-22 |
|
Profitability Ratio |
|
|
|
|
|
Gross Profit |
28.75% |
30.47% |
28.67% |
28.07% |
|
EBITDA Margin |
11.20% |
11.98% |
10.99% |
10.97% |
|
EBIT Margin |
10.74% |
11.56% |
10.54% |
10.50% |
|
Pre-Tax Margin |
9.51% |
9.72% |
9.39% |
8.79% |
|
Net Profit Margin |
7.13% |
6.75% |
6.95% |
6.35% |
|
|
|
|
|
|
|
Return on Investment |
|
|
|
|
|
Return on Asset – ROA |
7% |
7% |
6% |
5% |
|
Return on Capital Employed – ROCE |
18% |
20% |
17% |
15% |
|
Return on Equity – ROE |
13% |
12% |
11% |
10% |
|
|
|
|
|
|
|
Liquidity Ratio (x) |
|
|
|
|
|
Current ratio |
1.72 |
1.50 |
1.48 |
1.45 |
|
Quick Ratio |
1.39 |
1.11 |
1.12 |
1.04 |
|
|
|
|
|
|
|
Turnover Ratio |
|
|
|
|
|
Receivables Turnover |
4.2 |
4.2 |
4.2 |
4.1 |
|
Inventory Turnover |
5.5 |
4.3 |
4.1 |
4.0 |
|
Payables Turnover |
2.3 |
2.2 |
2.3 |
2.3 |
|
Asset Turnover |
1.0 |
1.0 |
0.9 |
0.9 |
|
|
|
|
|
|
|
Solvency Ratio |
|
|
|
|
|
Debt to Equity |
0.08 |
0.05 |
0.05 |
0.06 |
|
Interest Coverage Ratio |
32 |
42 |
30 |
32 |
Voltas Limited - Financial Overview
Voltas Limited - Cash Flow Statement (₹ in crores)
|
|
Mar-19 |
Mar-20 |
Mar-21 |
Mar-22 |
|
Net Profit Before Tax |
677.41 |
744.31 |
709.21 |
697.30 |
|
Net Cash from Operating Activities |
-321.43 |
462.45 |
556.11 |
584.23 |
|
Net Cash Used for Investing Activities |
392.73 |
-210.49 |
-255.91 |
-364.63 |
|
Net Cash From (Used For) Financing Activities |
-18.25 |
-293.66 |
-121.51 |
-107.04 |
|
Net Increase in Cash and Cash Equivalents |
53.05 |
-41.70 |
178.69 |
112.56 |
|
Cash And Cash Equivalents at The Beginning of The Year |
257.93 |
310.98 |
269.28 |
447.97 |
|
Cash And Cash Equivalents at The End of the Year |
310.98 |
269.28 |
447.97 |
560.53 |
Voltas Limited - Profit and Loss Statement (₹ in crores)
|
|
Mar-19 |
Mar-20 |
Mar-21 |
Mar-22 |
|
Revenue from Operations |
7,124.07 |
7,658.08 |
7,555.78 |
7,934.45 |
|
Other Income |
186.25 |
230.60 |
188.86 |
189.19 |
|
Total Income |
7,310.32 |
7,888.68 |
7,744.64 |
8,123.64 |
|
|
|
|
|
|
|
Cost of Goods sold |
5,262.23 |
5,554.94 |
5,578.46 |
5,896.66 |
|
Gross Profit |
2,048.09 |
2,333.74 |
2,166.18 |
2,226.98 |
|
|
|
|
|
|
|
Excise Duty |
- |
- |
- |
- |
|
Employee Benefits Expense |
641.86 |
671.72 |
601.68 |
617.62 |
|
Other Expenses |
608.27 |
744.76 |
734.28 |
738.62 |
|
EBITDA |
797.96 |
917.26 |
830.22 |
870.74 |
|
|
|
|
|
|
|
Depreciation and Amortisation Expense |
32.98 |
31.96 |
33.89 |
37.26 |
|
EBIT |
764.98 |
885.30 |
796.33 |
833.48 |
|
|
|
|
|
|
|
Finance Costs |
23.98 |
21.10 |
26.15 |
25.87 |
|
EBT before Exceptional Items, Share of Profit of Associates and Joint Ventures |
741.00 |
864.20 |
770.18 |
807.61 |
|
|
|
|
|
|
|
Share of Profit of Associates and Joint Ventures |
-51.82 |
-68.70 |
-60.97 |
-110.31 |
|
EBT before Exceptional Items |
689.18 |
795.50 |
709.21 |
697.30 |
|
|
|
|
|
|
|
Exceptional Items |
-11.77 |
-51.19 |
- |
- |
|
EBT |
677.41 |
744.31 |
709.21 |
697.30 |
|
|
|
|
|
|
|
Tax Expense |
163.53 |
223.26 |
180.42 |
191.30 |
|
PAT Non-Controlling Interests |
513.88 |
521.05 |
528.79 |
506.00 |
|
|
|
|
|
|
|
Non-Controlling Interests |
-5.97 |
-3.87 |
-3.65 |
-1.91 |
|
PAT |
507.91 |
517.18 |
525.14 |
504.09 |
|
|
|
|
|
|
|
EPS |
|
|
|
|
|
Basic |
15.35 |
15.63 |
15.87 |
15.23 |
|
Diluted |
15.35 |
15.63 |
15.87 |
15.23 |
|
|
|
|
|
|
|
Number of Shares |
|
|
|
|
|
Basic |
33.09 |
33.09 |
33.09 |
33.09 |
|
Diluted |
33.09 |
33.09 |
33.09 |
33.09 |
Voltas Limited - Balance Sheet (₹ in crores)
|
|
Mar-19 |
Mar-20 |
Mar-21 |
Mar-22 |
|
ASSETS: |
|
|
|
|
|
Non-Current Assets: |
|
|
|
|
|
Property, Plant and Equipment |
215.53 |
240.23 |
238.37 |
230.45 |
|
Capital Work-in-Progress |
15.66 |
26.28 |
8.81 |
59.29 |
|
Investment Property |
46.27 |
45.34 |
55.55 |
53.32 |
|
Goodwill |
72.31 |
72.31 |
72.31 |
72.31 |
|
Right-in-Use Assets |
- |
13.03 |
13.29 |
20.43 |
|
Other Intangible Assets |
8.93 |
9.48 |
8.46 |
7.17 |
|
Investments in Joint Ventures and Associates |
210.22 |
277.57 |
283.18 |
266.07 |
|
Finance Assets: |
|
|
|
|
|
Investments |
939.95 |
1,545.33 |
2,513.93 |
2,915.05 |
|
Trade Receivables |
29.84 |
6.39 |
- |
- |
|
Loans |
0.31 |
0.22 |
0.17 |
0.10 |
|
Other Financial Assets |
74.11 |
91.12 |
96.08 |
83.39 |
|
Income Tax Assets |
56.68 |
59.31 |
2.67 |
11.98 |
|
Deferred Tax Assets |
105.89 |
72.87 |
55.77 |
44.00 |
|
Other Non-Current Assets |
99.11 |
118.15 |
117.48 |
103.55 |
|
Total Non-Current Assets |
1,874.81 |
2,577.63 |
3,466.07 |
3,867.11 |
|
|
|
|
|
|
|
Current Assets: |
|
|
|
|
|
Inventories |
1,090.66 |
1,468.94 |
1,279.60 |
1,661.39 |
|
Contract Assets |
785.00 |
899.34 |
1,063.72 |
748.32 |
|
Financial Assets: |
|
|
|
|
|
Investments |
1,235.69 |
520.39 |
249.32 |
434.27 |
|
Trade Receivables |
1,803.17 |
1,827.25 |
1,800.93 |
2,109.67 |
|
Cash and Cash Equivalents |
310.99 |
269.56 |
448.15 |
558.90 |
|
Other Bank Balances |
10.12 |
38.85 |
10.64 |
12.77 |
|
Loans |
11.33 |
2.04 |
2.13 |
3.09 |
|
Other Financial Assets |
85.81 |
135.50 |
108.98 |
79.85 |
|
Other Current Assets |
314.40 |
416.56 |
225.94 |
270.96 |
|
Total Current Assets |
5,647.17 |
5,578.43 |
5,189.41 |
5,879.22 |
|
|
|
|
|
|
|
Total Assets |
7,521.98 |
8,156.06 |
8,655.48 |
9,746.33 |
|
|
|
|
|
|
|
EQUITY AND LIABILITIES: |
|
|
|
|
|
Equity: |
|
|
|
|
|
Equity Share Capital |
33.08 |
33.08 |
33.08 |
33.08 |
|
Other Equity |
4,076.91 |
4,247.13 |
4,960.27 |
5,466.48 |
|
Equity Attributable to Owners of the Company |
4,109.99 |
4,280.21 |
4,993.35 |
5,499.56 |
|
|
|
|
|
|
|
Non-Controlling Interest |
34.75 |
4,247.13 |
4,960.27 |
5,466.48 |
|
Total Equity |
4,144.74 |
8,527.34 |
9,953.62 |
10,966.04 |
|
|
|
|
|
|
|
Liabilities: |
|
|
|
|
|
Non-Current Liabilities: |
|
|
|
|
|
Contract Liabilities |
0.70 |
0.74 |
0.64 |
3.51 |
|
Financial Liabilities: |
|
|
|
|
|
Lease Liabilities |
- |
5.41 |
5.66 |
12.68 |
|
Other Financial Liabilities |
- |
23.91 |
19.41 |
14.89 |
|
Provisions |
84.66 |
87.47 |
89.91 |
103.03 |
|
Deferred Tax Liabilities |
6.59 |
1.42 |
- |
12.35 |
|
Other Non-Current Liabilities |
- |
6.60 |
6.32 |
6.32 |
|
Total Non-Current Liabilities |
91.95 |
125.55 |
121.94 |
152.78 |
|
|
|
|
|
|
|
Current Liabilities: |
|
|
|
|
|
Contract Liabilities |
331.49 |
556.92 |
421.55 |
354.19 |
|
Financial Liabilities: |
|
|
|
|
|
Borrowings |
314.65 |
212.44 |
251.40 |
343.19 |
|
Lease Liabilities |
- |
- |
3.55 |
4.96 |
|
Trade Payables: |
|
|
|
|
|
Total Outstanding Dues of Micro and Small Enterprises |
49.45 |
35.47 |
160.42 |
144.19 |
|
Other Creditors |
2,325.04 |
2,653.42 |
2,304.11 |
2,797.86 |
|
Other Financial Liabilities |
84.47 |
90.35 |
94.52 |
103.54 |
|
Provisions |
129.89 |
116.98 |
119.55 |
158.85 |
|
Income Tax Liabilities |
11.76 |
6.08 |
75.95 |
60.29 |
|
Other Current Liabilities |
38.54 |
42.15 |
73.04 |
88.84 |
|
Total Current Liabilities |
3,285.29 |
3,713.81 |
3,504.09 |
4,055.91 |
|
|
|
|
|
|
|
Total Equity & Liabilities |
7,521.98 |
12,366.70 |
13,579.65 |
15,174.73 |
Industry Overview
-
Along with the local AC industry, Voltas also operates in the mechanical, electrical, and plumbing (MEP), heating, ventilation, and air conditioning (HVAC), and other international (mostly West Asian) markets. 94% of Voltas' sales come from these two businesses. However, each of these categories' revenues is fairly diversified in terms of the regions they serve and the goods and services they provide.
-
Consumer electricals such as fans, kitchen and cooking appliances, lighting fixtures, as well as white goods like washing machines, televisions, refrigerators, and air conditioners, are all included in this industry.
-
The organized sector is gaining market share from the unorganized sector in the consumer durables business. Estimates indicate that 30% of the market is still unorganized, giving listed Indian businesses a considerable opportunity to grow their market share going forward.
-
India is viewed by multinational organizations as one of the primary markets from which future growth is likely to originate. A favorable population composition and rising disposable income would be the main drivers of the consumer market's expansion in India.
-
The Indian consumer electronics and appliances market was valued at US$ 9.84 billion in 2021 and is projected to more than double to US$ 21.18 billion (Rs. 1.48 lakh crore) by 2025. Production of electronic hardware in the nation totaled US$63.39 billion in 2021.
-
According to estimates from 2021, India's markets for refrigerators, washing machines, and air conditioners were worth approximately US$ 3.82 billion, US$ 8.43 billion, and US$ 3.84 billion, respectively. The market for air conditioners is anticipated to increase from 65 lakh units in 2019 to 165 lakh units by 2025, while the market for refrigerators is anticipated to increase from 145 lakh units in 2019 to 275 lakh units by 2025.
-
With a committed investment of Rs. 4,614 crores (US$ 580.6 million) and 42 enterprises chosen under the PLI Scheme for White Goods in November 2021; 44,000 more direct jobs are anticipated to be created.
-
The PLI Scheme for White Goods received applications from 19 companies in April 2022, with committed investments of Rs. 1,548 crores (US$ 194.79 million).
-
As a result of the PLI scheme, 61 businesses have set up component manufacturing facilities in 111 locations spread throughout 14 states and UTs, resulting in the creation of jobs all over India.
Concall Overview (Q2FY2023)
-
In comparison to ₹1,737 crores in the same quarter the previous year, the company reported a marginal growth of 6% for the Q2FY2023 in consolidated total income.
-
Compared to ₹162 crores in the same quarter the previous year, profit before share of profit & loss from related joint ventures, and tax came to ₹149 crores. An extraordinary provision made on an international project during the current quarter had a further negative impact on profit before and after tax.
-
As of August 2022, Voltas was still the market leader in the RAC segment, holding a YTD market share of 22.8%, 750 basis points ahead of the No. 2 competitor.
-
On the revenue front, Q2 is a lean quarter for the UCP segment. The segment reported muted topline growth of 4% YoY due to prolonged monsoon and lower discretionary spending.
-
High-cost inventory has an impact on margins in the UCP category. The management anticipates that the same will have some effects in Q3FY23 as well. To maintain a balance between market share and margins, the management has set a margin outlook of a higher single-digit margin for the upcoming few quarters.
-
In the EMPS segment, one of the overseas projects, the main contractor unilaterally canceled the contract with Voltas in October and cashed the underlying bank guarantees as a result of the main contractor's customer terminating the main contractor's contract. Voltas has established a provision of INR 106.4 crores for this and is pursuing legal action.
-
The demand for capital equipment in the Engineering Products and Services industry was impacted by an increase in export duty fines in the iron ore market. Due to better capital equipment delivery for the textile industry and a strategic after-sales service strategy, the segment's revenue performed well during the quarter.
Voltas Limited - Technical Analysis
-
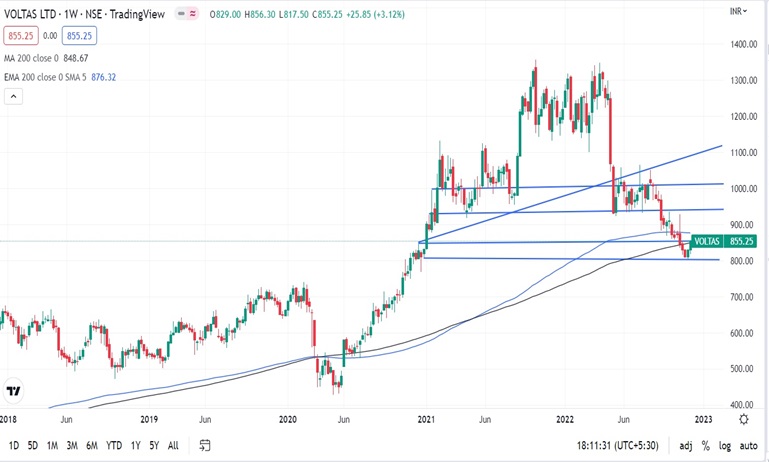
Stock is on a bullish trend on a monthly, weekly, and daily charts basis with a support level of ₹808 and a resistance level of ₹1,004.
-
One can accumulate this stock at current levels.
Voltas Limited - Peers Comparison
|
|
FY-2022 |
|||
|
|
Revenue (₹) |
Net Profit (₹) |
ROCE |
ROE |
|
Voltas Limited |
7,934 |
616 |
15% |
10% |
|
Blue Star Limited |
6,045 |
166 |
22.04% |
16.48% |
|
PG Electroplast Limited |
1,041 |
32 |
14.91 |
10.70% |
Voltas Limited - Recommendation Rationale
-
Along with the local AC industry, Voltas also operates in the mechanical, electrical, and plumbing (MEP), heating, ventilation, and air conditioning (HVAC), and other international (mostly West Asian) markets. 94% of Voltas' sales come from these two businesses. However, each of these categories' revenues is fairly diversified in terms of the regions they serve and the goods and services they provide. Dominating the market for room air conditioners nationwide, with both window and split models available. Over time, this has helped the UPBG segment grow its market share. At the end of August 2022, its market share was 22.8%.
-
In the long run, Voltas is well-positioned to profit from any growth in new order flow in its target markets because of its established market position in the project sector. While domestic order booking is relatively stronger, driven by strong orders from the water management, rural electrification, and urban infrastructure sectors, order booking in foreign markets is still subdued as a result of projects being delayed due to the economic slowdown and a cautious order picking strategy.
-
Low debt levels, comfortable profitability, and good liquidity are signs of Voltas Limited's low financial risk profile.
-
LIC has increased its shareholding in Q2FY2023 by 1.67% compared to Q1FY2023.
-
Demand for RAC is projected to be structurally driven soon due to shifting consumer lifestyles following the pandemic.
-
The rising income of a middle-class household in India will be a significant long-term driver of cooling product demand. With a 7% penetration, AC has the lowest market share among white goods.
Voltas Limited - Valuation
-
Voltas Limited has shown a revenue of growth of 5% CAGR for FY2018-2022.
-
The company’s net profit was reduced in FY2021 and FY2022 due to covid-19, an increase in the prices of raw materials, and losses made by Joint venture and associate.
-
The company made a loss of ₹6 crores due to an extraordinary provision made on an international project.
-
We anticipate the company could generate higher revenue for the following FY 2023, comparable to the prior year, based on the company's present performance in FY 2022.
-
We used data from the last five years (2018-2022) to anticipate revenue for the fiscal years 2023–2027.
Voltas Limited - Estimated Income Statement (₹ in crores)
|
|
Mar-23 |
Mar-24 |
Mar-25 |
Mar-26 |
Mar-27 |
|
|
2023-E |
2024-E |
2025-E |
2026-E |
2027-E |
|
Revenue |
8,571.44 |
9,044.31 |
9,543.70 |
10,071.14 |
10,628.24 |
|
COGS |
6,272.50 |
6,611.55 |
6,968.92 |
7,345.61 |
7,742.66 |
|
Gross Profit |
2,298.94 |
2,432.77 |
2,574.78 |
2,725.53 |
2,885.58 |
|
Employee Expenses |
669.07 |
705.23 |
743.35 |
783.53 |
825.88 |
|
Other Expenses |
836.33 |
881.54 |
929.19 |
979.41 |
1,032.35 |
|
EBITDA |
793.54 |
846.00 |
902.24 |
962.58 |
1,027.34 |
|
Depreciation |
36.99 |
40.77 |
44.50 |
48.22 |
51.97 |
|
EBIT |
756.55 |
805.23 |
857.75 |
914.36 |
975.37 |
|
Financial Cost |
23.48212 |
24.99318 |
26.62316 |
28.38042 |
30.2742 |
|
EBT |
733.07 |
780.24 |
831.12 |
885.98 |
945.10 |
|
Tax expenses |
183.2663 |
195.0593 |
207.7805 |
221.4951 |
236.2751 |
|
PAT |
549.80 |
585.18 |
623.34 |
664.49 |
708.83 |
-
We initiate coverage on Voltas Limited with a “Buy” and a 1-year Target Price of ₹1,035.
Disclaimer: This report is only for the information of our customers Recommendations, opinions, or suggestions are given with the understanding that readers acting on this information assume all risks involved. The information provided herein is not to be construed as an offer to buy or sell securities of any kind.
- Share :


Post a Comment
|
DISCLAIMER |
This report is only for the information of our customers. Recommendations, opinions, or suggestions are given with the understanding that readers acting on this information assume all risks involved. The information provided herein is not to be construed as an offer to buy or sell securities of any kind. ATS and/or its group companies do not as assume any responsibility or liability resulting from the use of such information.