WIPRO LTD.
Wipro Limited - Company Profile
Wipro Limited began its business as a vegetable oil manufacturer in 1945. During 1980s, Wipro entered the Indian IT industry by manufacturing and selling mini computers. Today, the Company is a global IT major which offers services to various sectors including financial services, retail, transportation, manufacturing, healthcare, energy and utilities, technology, telecom and media.
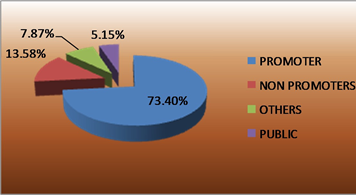
The Company is headquartered in Bangalore and operates through 72 plus global delivery centers in over 54 countries. For FY 2014, the Company’s total income from operations grew by 16.76 % to Rs. 39,133.30 Cr. as against Rs. 33,517.30 Cr. in FY 2013. For the same period, net profit went up by 30.75 % to Rs. 7,387.40 Cr. as against Rs. 5,650.20 Cr. in FY 2013. 50.7% of the overall revenue of the Company comes from U.S., followed by 28.6% from Europe, 8.9% from India and Middle East, 11.7% from the Asia Pacific and other emerging markets. The Company’s BFSI (Banking & Financial Services Industry) domain constitutes 26.6% of its total revenue.
Wipro Limited - STOCK INFORMATION
|
STOCK PRICE |
586.85 |
|
TARGET PRICE |
560-520 |
|
SECTOR |
COMPUTER/SOFTWARE |
|
SYMBOL (AT NSE) |
WIPRO |
|
ISIN |
INE075A01022 |
|
FACE VALUE (IN RS.) |
2.00 |
|
BSE CODE |
507685 |
Wipro Limited - STOCK FUNDAMENTALS
|
MARKET CAP |
144,824.59 |
|
BOOK VALUE |
118.90 |
|
EPS - (TTM) (IN RS. CR.) |
34.04 |
|
P/E |
17.23 |
|
INDUSTRY P/E |
24.22 |
Cross currency stress to persist in IT cos Q4 numbers:
March quarter earnings of IT services players are likely to reflect continued cross-currency pressure, usual delays in project ramp-up at the beginning of the calendar year and challenges related to weather patterns in North America. We expect management commentary to be cautious given the uncertain macro environment in developed markets, and volatility in commodity and currency markets.
However, discretionary spend pipeline in the US and out- sourcing pipeline in Europe will remain as the positive trends, Modest volume growth, business investments and cross-currency headwinds would be key margin dampen- ers in Q4FY15. We expect most of the companies to indicate low-teens growth in FY16, which would be in line with NASSCOM guidance of 12-14 percent. We Expect FY 16-17 lower earnings for the top 4 players and 3-10 percent for others to build in the cross-currency headwind and weaker volume growth.
SHAREHOLDING PATTERN
RESULTS (Quarterly )(Rs CR.)
|
|
DEC' 14 |
SEP' 14 |
JUN' 14 |
MAR 14 |
DEC' 13 |
|
Sales |
10,521.20 |
10,358.20 |
10,104.10 |
10,401.80 |
10,069.10 |
|
Operating profit |
2,376.40 |
2,362.90 |
2,441.90 |
2,732.30 |
2,494.90 |
|
Interest |
145.00 |
49.40 |
81.90 |
94.30 |
92.40 |
|
Gross profit |
2,789.00 |
2,780.50 |
2,830.40 |
3,158.20 |
2,843.60 |
|
EPS (Rs) |
8.07 |
8.07 |
8.38 |
9.54 |
8.31 |
TECHNICAL VIEW
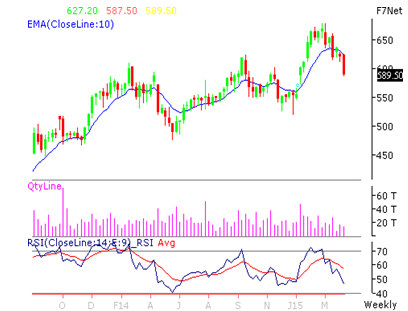
WIPRO FUTURE is looking weak on charts, short build up has been seen, we may see more downside, if it sustains below 600 levels. We advise selling around 590-600 levels with strict stop loss of 625 for the targets of 560-520 levels.
|
SYMBOL |
VALUE |
ACTION |
|
RSI(14) |
34.410 |
SELL |
|
STOCH(9,6) |
14.177 |
OVERSOLD |
|
STOCHRSI(14) |
54.015 |
NEUTRAL |
|
MACD(12,26) |
-6.510 |
SELL |
|
ADX(14) |
64.908 |
SELL |
|
WILLIAMS %R |
-92.037 |
OVERSOLD |
|
CCI(14) |
-102.4002 |
SELL |
|
ATR(14) |
5.1250 |
LESS VOLATILITY |
|
HIGH/LOWS(14) |
-2.8607 |
SELL |
|
ULTIMATE OSCILLATOR |
36394 |
SELL |
|
ROC |
-1.453 |
SELL |
|
BULL/BEAR POWER()13 |
-12.0760 |
SELL |
|
BUY: 0 SELL: 8 NEUTRAL: 3 |
SUMMARY : STRONG SELL |
|
Our Other Recommendation for Next Week
|
SCRIP |
ACTION |
CMP |
ENTRY |
SL |
TGT |
TIME FRAME |
|
HINDALCO |
BUY |
140.05 |
140-142 |
137 |
144-148 |
ONE WEEK |
|
JSWSTEEL |
BUY |
960.6 |
960-970 |
950 |
980-1000 |
ONE WEEK |
|
IDBI |
BUY |
82.2 |
80-82 |
78 |
84-85 |
ONE WEEK |
|
INDUSIND BANK |
SELL |
880.2 |
890-900 |
920 |
870-850 |
ONE WEEK |
|
UPL |
SELL |
430.95 |
435-440 |
450 |
420-405 |
ONE WEEK |
Performance of Previous Week
|
SCRIP |
LOT |
ACTION |
ENTRY |
SL |
TGT |
P&L |
REMARK |
CLOSE/LOW/HIGH |
|
SSLT |
1000 |
BUY |
195-200 |
185 |
210-220 |
10000.00 |
FIRST TGT HIT |
211.35 / 213.80 |
|
TATA STEEL |
500 |
BUY |
340-345 |
330 |
355-370 |
6500.00 |
NEAR TGT |
347.10 / 353.95 |
|
ASIAN PAINT |
500 |
BUY |
845-855 |
835 |
865-880 |
5000.00 |
FIRST TGT HIT |
821.15 / 868.85 |
|
VOLTAS |
1000 |
BUY |
304-308 |
300 |
312-316 |
-4000.00 |
SL TRG |
295.60 / 311.40 |
|
SBIN |
1250 |
BUY |
278-280 |
274 |
284-288 |
0.00 |
NOT OPEN |
291.95 / 295.50 |
|
RECL |
1000 |
BUY |
340-345 |
332 |
352-360 |
-8000.00 |
SL TRG |
331.60 / 349.95 |
|
NET PROFIT |
|
|
|
|
|
9500.00 |
|
|
- Share :


Post a Comment
|
DISCLAIMER |
This report is only for the information of our customers. Recommendations, opinions, or suggestions are given with the understanding that readers acting on this information assume all risks involved. The information provided herein is not to be construed as an offer to buy or sell securities of any kind. ATS and/or its group companies do not as assume any responsibility or liability resulting from the use of such information.