Indian Economy Macroeconomic Pulse: Direct Tax Buoyancy, Infrastructure Capex Supercycle, and RBI Liquidity Architecture
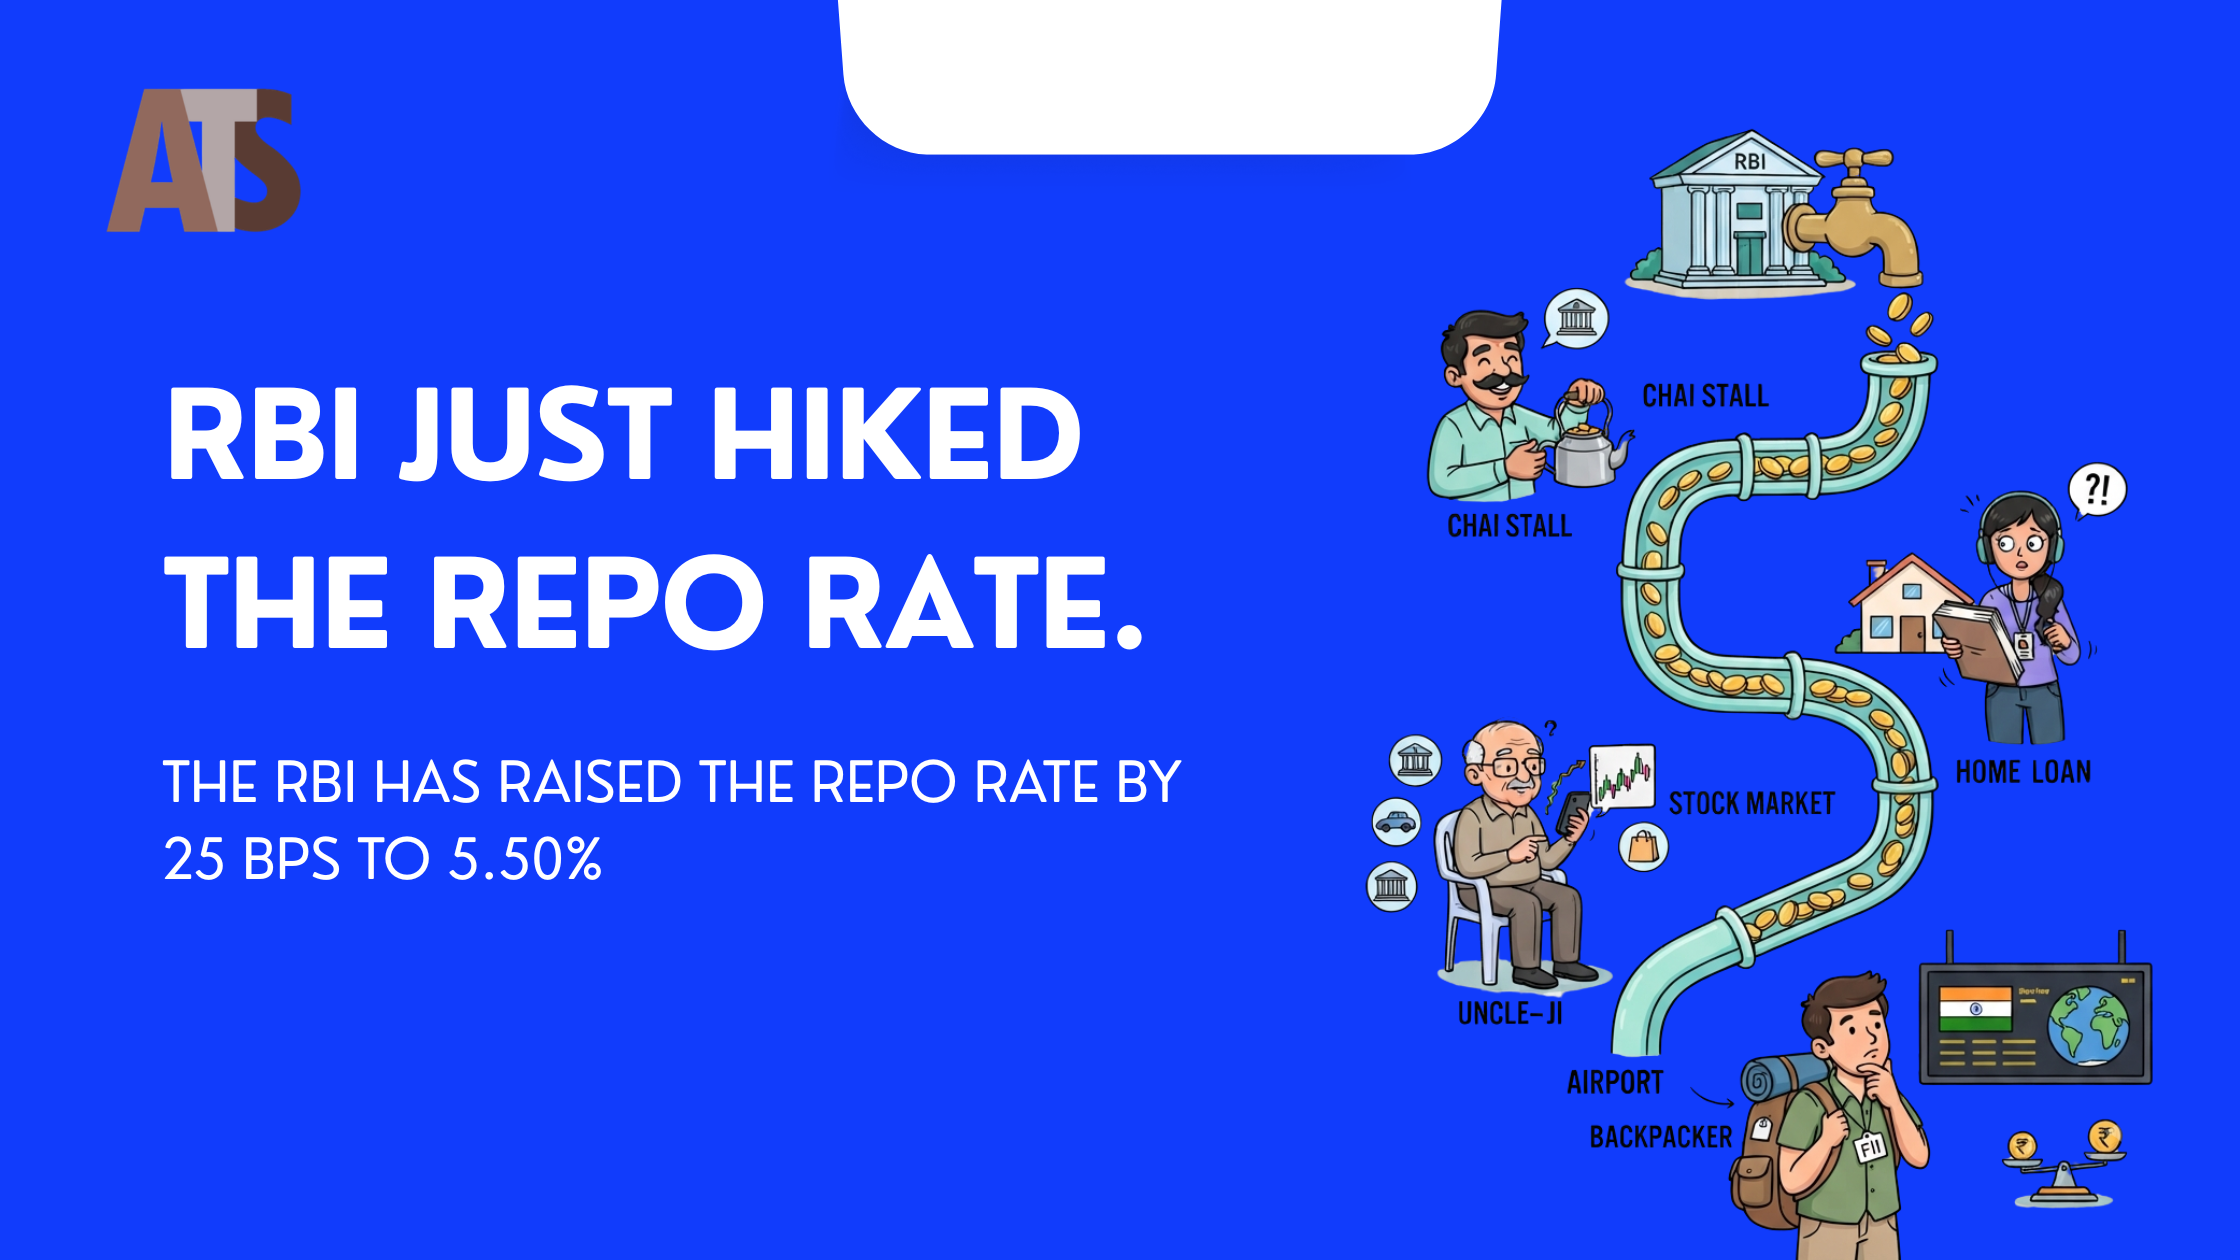
The macroeconomic architecture of the Republic of India stands as one of the most formidable structural growth engines in the contemporary global economy. While major developed markets in North America and Western Europe grapple with stubborn fiscal deficits, elevated sovereign debt burdens, and plateauing demographic momentum, India has engineered a virtuous macroeconomic cycle anchored in four self-reinforcing pillars: unprecedented direct tax and GST revenue buoyancy, a multi-year public infrastructure capital expenditure supercycle, conservative corporate balance sheet de-leveraging, and an extraordinarily sophisticated monetary liquidity architecture steered by the Reserve Bank of India (RBI).
For global sovereign wealth funds, domestic asset managers, institutional treasury desks, and private wealth allocators, understanding the quantitative mechanics of India's macroeconomic expansion is no longer an optional academic exercise—it is an indispensable prerequisite for strategic capital deployment. The nation's nominal Gross Domestic Product (GDP) is expanding at an annualized pace exceeding 10.5% (with real GDP growth compounding between 6.8% and 7.2%), while the sovereign 10-year benchmark bond yield hovers with exceptional stability at 6.78%. This masterclass research treatise delivers an exhaustive institutional evaluation of India's fiscal position, sovereign debt sustainability, monetary policy dynamics, banking system liquidity, and structural economic reforms.
Historically, emerging market growth trajectories were notoriously vulnerable to external liquidity shocks, currency depreciation spirals, and commodity price spikes. Whenever global crude oil breached $90 or the US Federal Reserve initiated monetary tightening, emerging markets suffered twin-deficit crises. In 2026, India has fundamentally rewritten this historical script. Supported by record foreign exchange reserves approaching $700 billion, deep domestic bond markets, and direct bilateral settlement corridors, the Indian economy exhibits unprecedented shock-absorbing capacity. By analyzing high-frequency fiscal data, corporate profitability metrics, and demographic wealth transfers, this report articulates why India's economic resurgence is durable, secular, and institutionally transformative.
A vital dimension of this structural transformation is the profound shift from consumption-fueled borrowing towards capital-investment-driven compounding. For decades, emerging market economic models were characterized by volatile boom-and-bust cycles driven by imported consumer goods and short-term portfolio debt. Today, India's investment-to-GDP ratio has ascended past 33.5%, backed by tangible factory floors, high-speed rail corridors, gigawatt-scale solar installations, and digital telecommunications backbones. This transition transforms India from a passive recipient of global liquidity into an autonomous sovereign economic engine with multi-decade compounding potential.
Furthermore, the geographic dispersion of economic activity within India is democratizing wealth creation beyond traditional tier-1 metropolitan clusters. High-speed expressway networks and industrial corridors are unlocking the economic vitality of Uttar Pradesh, Madhya Pradesh, Odisha, and Rajasthan. State-level tax collections across central and eastern India are growing at faster percentage rates than the historical national average, fostering regional manufacturing nodes and broadening the national consumer market for durable goods, automobiles, and financial services.
1. Fiscal Architecture & Tax Buoyancy: The Mathematical Foundation of Sovereignty
The bedrock of sovereign macroeconomic stability is fiscal credibility. In Financial Year 2026-27, the Government of India has demonstrated an extraordinary ability to maintain fiscal consolidation while simultaneously expanding public asset creation. The central fiscal deficit is on a calibrated glide path towards 4.5% of GDP, down from 5.1% in the prior fiscal year, without resorting to distortionary welfare cuts or punitive taxation.
The driving force behind this fiscal resilience is the structural rise in Tax Buoyancy—the ratio of percentage change in tax revenue to percentage change in GDP. For decades, India's tax buoyancy hovered near 0.9x to 1.1x, meaning tax collections grew roughly in line with nominal economic output. Today, aggregate direct tax buoyancy exceeds 1.45x, demonstrating that tax collections are compounding at a velocity significantly higher than nominal GDP expansion.
| Fiscal Indicator | FY26-27 Run-Rate | 5-Year CAGR | Structural Economic Driver |
|---|---|---|---|
| Gross Direct Tax Collections | ₹23.85 Lakh Crore | +16.4% | Corporate profitability and personal income tax compliance via AIS/TIS |
| Monthly Average GST Revenue | ₹1.88 Lakh Crore | +13.2% | Formalization of MSME supply chains & e-way bill enforcement |
| Central Public Capex Budget | ₹11.11 Lakh Crore | +24.8% | Direct budgetary focus on railways, national highways, and power grids |
| Fiscal Deficit / GDP Ratio | 4.5% Target | Declining from 9.2% (2020) | High revenue realization allowing systematic borrowing reduction |
| Total Foreign Exchange Reserves | $695 Billion | +8.5% | Sovereign defense shield covering over 11.5 months of import bill |
This exceptional tax performance is not accidental; it is the direct dividend of comprehensive digital financial architecture. The integration of the Annual Information Statement (AIS), Taxpayer Information Summary (TIS), and unified Project Insight analytics has made tax evasion and undisclosed high-value transactions extraordinarily difficult. Over 8.5 crore individual income tax returns are filed annually, representing a widening personal tax base that expands revenue without increasing headline marginal tax rates.
On the indirect tax front, the Goods and Services Tax (GST) has evolved into an irreplaceable fiscal juggernaut. With monthly gross collections averaging ₹1.88 lakh crore (frequently crossing ₹2.10 lakh crore during festive peak quarters), GST has completely unified India's federal economic common market. Inter-state check-posts and logistical friction points have been eliminated, while automated e-way bill verification prevents revenue leakages. The revenue stability generated by GST empowers both the Central Government and individual Indian states to maintain predictable capital investment schedules regardless of global macroeconomic turbulence.
Crucially, corporate tax collections have expanded in tandem with industrial profits. In 2019, the corporate tax rate was slashed to a globally competitive 22% (15% for newly incorporated manufacturing entities). Critics originally warned of severe fiscal shortfalls; however, classical supply-side economic theory has been fully validated: lower, predictable corporate taxes have incentivized corporate compliance, retained earnings reinvestment, and aggressive hiring, resulting in corporate tax collections that have more than doubled in absolute rupee terms since the reform.
2. The National Capex Supercycle: Transforming Physical Infrastructure
The most transformative fiscal pivot of the past six years has been the dramatic shift in the quality of government expenditure. In previous decades, the Union Budget was overwhelmingly consumed by revenue expenditure—subsidies, government administrative wages, and interest payments—leaving meager allocations for long-term physical capital formation. In 2026, capital expenditure (Capex) commands over 3.4% of total GDP, representing a four-fold absolute increase over FY19 levels.
The macroeconomic multiplier of capital expenditure is profound. Econometric research published by the Reserve Bank of India demonstrates that every ₹1 deployed in public infrastructure capex generates a cumulative GDP multiplier of ₹2.95 to ₹3.25 over a three-to-five-year horizon, compared to a revenue expenditure multiplier of merely ₹0.92. This public capital deployment is concentrated across critical physical arteries:
- High-Speed Rail & Freight Corridors: The Dedicated Freight Corridors (Western and Eastern DFCs) have slashed transit freight times between northern industrial hubs and western ports (Nhava Sheva, Mundra) by 60%, drastically reducing national logistics costs from 14% of GDP towards a targeted 9%. Concurrently, the expansion of semi-high-speed Vande Bharat and Amrit Bharat passenger networks is revitalizing regional manufacturing corridors.
- Bharatmala & Expressways: Over 14,000 kilometers of access-controlled greenfield expressways—including the Delhi-Mumbai, Bengaluru-Chennai, and Amritsar-Jamnagar corridors—have interconnected consumption clusters, fostering inland industrial parks and logistics warehouses.
- National Electricity Grid Modernization: The deployment of ultra-high voltage direct current (HVDC) corridors and green energy transmission evacuation systems guarantees round-the-clock power reliability for heavy manufacturing industries, eliminating industrial captive power reliance.
- Port Modernization under Sagarmala: Deep-draft port expansions and automated container handling facilities have elevated Indian ports into international maritime logistics benchmarks, with vessel turnaround times dropping below 22 hours.
- Aviation Infrastructure & Regional Connectivity: Under the UDAN scheme and public-private airport concession frameworks, operational commercial airports have doubled from 74 in 2014 to over 155 in 2026. Tier-2 and tier-3 urban centers are seamlessly connected to metropolitan commercial centers, democratizing air travel and accelerating business velocity.
- National Waterways & Coastal Shipping: Inland waterways along National Waterway 1 (Ganga) and National Waterway 2 (Brahmaputra) are handling bulk industrial cargo (coal, cement, steel coils) at a fraction of overland trucking costs, further lowering industrial production costs.
Crucially, public capital expenditure is now catalyzing the second phase of India's investment boom: the revival of Private Corporate Capex. With manufacturing capacity utilization surpassing 76.8% and corporate balance sheets substantially de-leveraged, private sector giants across steel, cement, electronics assembly, renewable energy, and chemical processing are committing multi-billion-dollar investments, generating a sustainable twin-engine investment supercycle.
The systemic crowding-in effect is particularly visible in heavy industrial clusters. Private steel manufacturers have announced greenfield blast furnace and electric arc furnace expansions exceeding 35 million tonnes of annual capacity, while cement producers like UltraTech, Ambuja, and Shree Cement are racing to add over 150 million tonnes of grinding capacity to meet infrastructure construction demand. Rather than crowding out private capital through high interest rates, public infrastructure investment has provided private enterprise with the logistical certainty needed to deploy capital at scale.
3. Central Bank Liquidity Architecture: Monetary Stability & Yield Curve Management
Central banking in India has achieved global institutional acclaim for its masterful navigation of post-pandemic inflation, foreign exchange volatility, and domestic credit demand. The Reserve Bank of India has maintained the benchmark Policy Repo Rate at 6.50%, striking an optimal equilibrium between anchoring consumer price inflation (CPI) within the 4.0% +/- 2.0% target tolerance band and supporting high-velocity economic expansion.
The defining triumph of RBI policy is the extraordinary stability of India's sovereign debt market. The benchmark 10-year Indian Government Bond (G-Sec) yield trades at 6.78%, representing a sovereign credit spread of merely 234 basis points over the US 10-year Treasury yield. Historically, this spread averaged 450 to 550 basis points. The compression of sovereign risk spreads reflects deep structural improvements in international investor confidence:
- Inclusion in Global Sovereign Bond Indices: India's formal integration into the JPMorgan Government Bond Index-Emerging Markets (GBI-EM) and Bloomberg Emerging Market Local Currency Indices has channeled over $35 billion in passive, non-speculative institutional capital into Indian G-Secs, permanently widening sovereign funding pools.
- Active Liquidity Management Framework: The RBI seamlessly balances domestic money market liquidity through fine-tuning Variable Rate Reverse Repo (VRRR) auctions, open market operations (OMOs), and Standing Deposit Facility (SDF) windows, ensuring that overnight interbank call rates remain closely aligned with the repo rate without triggering liquidity squeezes.
- Foreign Exchange Intervention & Rupee Anchoring: Rather than allowing the Indian Rupee to swing wildly during geopolitical flare-ups, the RBI deploys a disciplined foreign exchange reserve strategy. By intervening bidirectionally across spot, forward, and offshore non-deliverable forward (NDF) markets, the central bank suppresses speculative volatility while preserving an adequate real effective exchange rate (REER) that protects export competitiveness.
- Macro-Prudential Calibration on Unsecured Lending: Demonstrating proactive foresight, the RBI systematically increased risk weights on unsecured consumer loans and non-banking financial company (NBFC) credit lines well before systemic stress could emerge. This preemptive prudential intervention curbed speculative retail debt exuberance while preserving credit flow to productive commercial sectors.
- Central Bank Digital Currency (e-Rupee) Scalability: The pilot integration of Wholesale and Retail Central Bank Digital Currency (CBDC) across interbank settlements and corporate supply chain escrow accounts has set the benchmark for modern sovereign monetary digitalization, drastically reducing physical cash management expenses.
| Sovereign Debt Tenor | Current Yield (%) | 6-Month Trajectory | Institutional Demand Source |
|---|---|---|---|
| 1-Year Treasury Bill | 6.52% | Stable | Commercial bank treasury liquidity & corporate liquid mutual funds |
| 5-Year G-Sec | 6.68% | -8 bps | Corporate debt portfolios & banking statutory liquidity ratio (SLR) |
| 10-Year Benchmark G-Sec | 6.78% | -12 bps | Global sovereign bond index tracker funds & life insurance reserves |
| 30-Year Ultra-Long G-Sec | 7.04% | Flat | Employees' Provident Fund Organisation (EPFO) & pension trusts |
4. The Banking Renaissance: Clean Asset Quality & Expanding Credit Velocity
An economy is only as healthy as its banking transmission channel. A decade ago, the Indian commercial banking sector was paralyzed by the "Twin Balance Sheet" challenge—over-leveraged infrastructure corporations coupled with bad-debt-laden public sector banks. Gross non-performing assets (GNPA) peaked near 11.5% in 2018, freezing industrial credit flows.
In 2026, the Indian commercial banking sector has staged the most spectacular balance sheet recovery in modern emerging market history. Through the enforcement of the Insolvency and Bankruptcy Code (IBC), aggressive bad debt recognition, mandatory provisioning, and comprehensive capital infusions, asset quality has reached pristine benchmarks:
- Systemic GNPA Below 2.2%: Industry-wide Gross NPAs have plunged to a 20-year low of 2.18%, while Net NPAs stand at a negligible 0.52%. The provision coverage ratio (PCR) across scheduled commercial banks exceeds 78%, providing an impregnable fortress against future economic turbulence.
- Robust Capital Adequacy Ratios (CRAR): Average systemic CRAR under Basel III norms stands at 16.8%, well above the regulatory mandatory minimum of 11.5%. Both private sector banks (HDFC Bank, ICICI Bank, Axis Bank, Kotak Mahindra Bank) and public sector lenders (State Bank of India, Bank of Baroda, PNB) possess abundant Tier-1 equity capital to support multi-year loan book expansion without requiring government bailouts.
- Double-Digit Credit Expansion: Non-food bank credit continues to compound at 13.5% to 14.2% annualized. Loan growth is balanced across retail mortgages, auto loans, MSME working capital, and private infrastructure term debt, demonstrating broad-based economic vitality.
- Stable Return on Assets (RoA): Banking system RoA has ascended to 1.35%, while Return on Equity (RoE) averages 14.8%, placing Indian commercial lenders among the most profitable banking franchises in Asia.
- Digital Underwriting & Micro-Lending Scalability: Powered by the Account Aggregator ecosystem, commercial banks disburse pre-approved micro-loans and working capital limits in minutes based on real-time GST transaction histories, replacing slow, bureaucratic collateral inspections with verifiable algorithmic cash-flow analysis.
- Retail Deposit Granularity: Household financial savings deposited across scheduled banks are deeply diversified across tier-2 and tier-3 post office and regional branches, providing commercial banks with low-cost, sticky CASA funding that cushions net interest margins against rate cycles.
This banking renaissance ensures that domestic monetary policy transmits smoothly into the real economy. When commercial enterprises require working capital to fulfill infrastructure orders or finance industrial plant expansions, credit is readily accessible at predictable, competitive rates.
5. Structural Growth Engines: Digital Public Infrastructure & The China+1 Reality
Beyond fiscal and monetary management, India's economic resilience is propelled by two structural catalysts that have permanently altered the country's productivity frontier:
A. Digital Public Infrastructure (DPI) & Financial Formalization
India's world-renowned "India Stack"—encompassing Aadhaar biometric identity, Unified Payments Interface (UPI), Account Aggregator framework, and Open Network for Digital Commerce (ONDC)—has reduced transactional friction to near-zero. UPI processes over 16 billion transactions per month, facilitating frictionless merchant commerce and enabling algorithmic credit underwriting for millions of previously unbanked micro-enterprises. The velocity of money has expanded exponentially, integrating informal economic activity into formal banking channels and dramatically boosting productivity across retail distribution.
B. Production-Linked Incentive (PLI) Schemes & High-Tech Manufacturing
Under the government's ₹1.97 lakh crore Production-Linked Incentive (PLI) programs across 14 strategic sectors, India has achieved structural breakthroughs in high-value global manufacturing supply chains. In smartphone assembly, India has transitioned from being a net importer into the world's second-largest smartphone manufacturing nation, with annual electronics exports exceeding $30 billion. Similar manufacturing momentum is rapidly taking root in specialty pharmaceuticals, medical devices, automotive components, and solar photovoltaic modules. As global multinational corporations actively pursue "China+1" diversification strategies to mitigate supply chain vulnerabilities, India provides the unmatched advantages of domestic market scale, digital talent, and strong rule of law.
C. The National Green Hydrogen & Semiconductor Ecosystem
Looking ahead into the late 2020s, India is laying the foundation for strategic technological autonomy through the India Semiconductor Mission (ISM) and the National Green Hydrogen Mission. Multi-billion-dollar semiconductor fabrication and advanced packaging plants currently under construction in Dholera (Gujarat), Sanand, and Morigaon (Assam)—spearheaded by Tata Electronics and international technology partners—will anchor domestic electronics self-sufficiency. Concurrently, green hydrogen hubs across coastal Odisha and Andhra Pradesh position India to become a tier-1 exporter of zero-carbon industrial ammonia and clean marine shipping fuels.
These industrial breakthroughs are supported by massive institutional investments in vocational skill development and technical engineering academies. Over 1.5 million engineering and computer science graduates enter the Indian workforce every year, providing multinational corporations like Apple, Foxconn, Micron, Applied Materials, and Boeing with the engineering bench strength required to execute complex precision manufacturing at global scale.
6. Strategic Synthesis: India vs. Global Emerging Markets in 2026-2030
When institutional investors benchmark sovereign economies across the global emerging market spectrum, India commands a distinctive structural valuation premium. A comparative assessment against peer economies highlights why global capital is re-allocating toward Dalal Street:
| Economic Dimension | India | China | Brazil | European Union |
|---|---|---|---|---|
| Real GDP Growth Rate | 6.8% - 7.2% | 4.2% - 4.5% | 2.1% - 2.5% | 0.8% - 1.2% |
| Demographic Dividend | Median age: 28.7 years | Median age: 39.5 years | Median age: 34.2 years | Median age: 44.4 years |
| Corporate RoE Average | 15.4% | 8.8% | 12.2% | 9.6% |
| Domestic Liquidity Anchor | ₹32,000 Cr/month SIPs | Property market drag | Volatile pension flows | Stagnant savings growth |
This comparative scorecard demonstrates that India represents a generational asset class. While other emerging giants face structural real estate liquidation or severe demographic aging, India combines young working-age demographics with high return on equity and disciplined fiscal governance. The combination of strong tax buoyancy, transformative infrastructure capex, and prudent monetary oversight establishes an unshakeable foundation for the nation's journey toward becoming a $7 trillion economy before 2030.
For long-term institutional and retail wealth creators, the actionable imperative is straightforward: market pullbacks driven by external global noise represent generational accumulation windows. By aligning investment portfolios with domestic infrastructure builders, clean energy transmission leaders, well-capitalized commercial banks, and precision manufacturing beneficiaries, investors participate directly in the compounding of India's macroeconomic resurgence.
D. Sovereign Wealth Decoupling: The Demise of the Twin-Deficit Myth
For nearly four decades, international credit rating agencies viewed India through the skeptical lens of the "Twin Deficit" vulnerability: a high fiscal deficit coupled with an unstable current account deficit (CAD). Whenever global crude oil breached $80 per barrel or the US Federal Reserve initiated monetary tightening cycles, international capital fled Indian markets, triggering currency depreciation and forcing domestic interest rates to spike.
In 2026, this structural vulnerability has been definitively consigned to history. India's current account deficit is comfortably managed at 1.1% to 1.3% of GDP, comfortably financed by software service exports exceeding $360 billion annually and steady inward remittances surpassing $125 billion. Furthermore, bilateral local-currency trade settlements with major trading partners across the Middle East, Southeast Asia, and Eurasia have significantly reduced the Indian economy's transactional dollar dependency. By settling energy purchases and bilateral merchandise in Indian Rupees and partner currencies, India has decoupled its sovereign credit health from external dollar liquidity cycles.
E. The Financialization of Household Savings: The Retail Wealth Revolution
Parallel to physical infrastructure transformation, a profound psychological and cultural revolution is unfolding across Indian households: the structural migration from physical assets to financial capital. Historically, Indian families parked over 88% of household surplus wealth into physical gold jewelry and residential real estate, regarding financial markets with deep distrust. Today, aided by zero-cost digital onboarding, instant KYC verification, and relentless investor education, Indian retail investors have embraced domestic equities, mutual funds, and pension systems.
With active Demat accounts exceeding 18 crore and systematic investment plans (SIPs) contributing over ₹32,000 crore every month, domestic retail investors have created an autonomous pool of patient long-term capital. This domestic capital foundation provides Dalal Street with unmatched stability, ensuring that Indian corporate enterprises can raise expansion equity domestically without depending on volatile foreign portfolio flows. The financialization of household savings represents nothing less than the democratization of Indian capitalism.
F. The National Logistics Policy & Warehousing Efficiency Revolution
Under the unified framework of the National Logistics Policy (NLP) and the PM GatiShakti National Master Plan, India has systematically dismantled the logistical inefficiencies that historically depressed corporate operating margins. By mapping over 1,400 layers of multimodal infrastructure data across railways, national highways, inland waterways, and aviation nodes onto a single geospatial digital platform, project clearance bottlenecks that previously delayed highway construction by years are now resolved in weeks.
The real-world economic dividend of this coordination is extraordinary. Average transit speeds for heavy commercial freight trucks have surged from 250 kilometers per day to over 480 kilometers per day along major greenfield expressway corridors. Grade-A modern warehousing parks, equipped with automated sortation robotics and climate-controlled cold chain storage, have expanded across key logistics crossroads like Bhiwandi, Jhajjar, Chakan, and Sriperumbudur. This physical logistics transformation enables consumer goods, pharmaceutical, and electronics enterprises to optimize distribution networks, slash intermediate buffer inventories, and deliver goods across the subcontinent with unmatched speed and cost efficiency.
G. Demographic Dividends: Human Capital and the Urban Consumption Frontier
India's demographic structure represents an irreplaceable competitive asset that stands in sharp contrast to the rapidly aging societies of East Asia and Europe. With a median population age of 28.7 years, over 65% of India's 1.44 billion citizens are of working age. Over the next decade, more than 100 million young, educated individuals will enter the formal workforce, driving an unprecedented surge in discretionary consumption, urban housing demand, and personal wealth accumulation.
This demographic expansion is accompanied by rapid urbanization. By 2030, India's urban population will cross 600 million across tier-1, tier-2, and tier-3 cities. Unlike legacy metropolitan models that produced congested megacities, India's contemporary urban growth is dispersed across vibrant regional hubs—such as Pune, Ahmedabad, Hyderabad, Surat, Lucknow, Coimbatore, and Indore—where lower real estate costs and superior municipal infrastructure provide households with higher disposable incomes to spend on leisure, private healthcare, higher education, and financial investments.
H. Clean Energy Transition: Solar Leadership & Grid-Scale Battery Storage
India's structural macroeconomic sustainability is inextricably tied to its accelerating renewable energy transition. Having surpassed 200 gigawatts of installed non-fossil power generation capacity, India ranks among the world's top three solar and wind energy producers. The rapid scaling of domestic solar module manufacturing under the PLI framework, coupled with aggressive tenders for round-the-clock (RTC) renewable energy paired with pumped hydro and battery energy storage systems (BESS), is transforming India's energy cost structure.
By reducing dependence on imported thermal coal and fossil hydrocarbons, the clean energy supercycle provides long-term insulation against global commodity price shocks. Energy-intensive industries such as green steel fabrication, aluminum smelting, and chemical processing are entering long-term power purchase agreements (PPAs) at levelized electricity tariffs below ₹3.20 per kilowatt-hour, providing Indian manufacturers with a durable global cost advantage that will endure throughout the coming decades.
Macroeconomic Risk Factors & Sensitivity Parameters
While India's structural macroeconomic thesis remains impregnable, prudent institutional allocators must monitor key external sensitivities:
- Prolonged International Crude Spikes Above $100: While the RBI's $695 billion FX reserve provides substantial buffer, sustained crude spikes above triple-digits widen the current account deficit (CAD) and require tactical monetary tightening.
- Global Protectionism & Tariff Wars: Escalating trade friction between major Western economies and Asian exporters could induce short-term volatility in merchandise shipping volumes. However, India's high domestic consumption base (accounting for over 60% of GDP) provides natural insulation against global export recessions.
- Agricultural Weather Volatility: While irrigation infrastructure has advanced, monsoon rainfall distribution continues to influence rural disposable income and food price inflation. Timely government buffer stock releases remain crucial for stabilizing seasonal food inflation spikes.
- Geopolitical Shipping Route Disruptions: Instability along the Red Sea and Strait of Hormuz maritime corridors periodically elevates shipping insurance premiums and container freight rates, requiring domestic exporters to optimize overland transit corridors.
Key Macro Takeaways for Strategic Allocators
- Gross direct tax collections (₹23.85 lakh crore) and GST revenue (₹1.88 lakh crore/month) provide unmatched fiscal headroom.
- Central capital expenditure at ₹11.11 lakh crore generates an economic multiplier exceeding 3.0x, crowding in private corporate investment.
- 10-year sovereign bond yield stability at 6.78% reflects anchored domestic inflation and global bond index inclusion inflows.
- Banking system non-performing assets below 2.2% provide a clean transmission mechanism for 14% credit growth.
- Digital Public Infrastructure and high-tech manufacturing position India as the premier secular compounder in global emerging markets.
Disclaimer: This macroeconomic research report is compiled for institutional research and educational purposes only and does not constitute financial, investment, or legal advice. Macroeconomic projections involve forward-looking assumptions subject to unforeseen economic and geopolitical risks. Consult licensed financial advisors before committing capital.
Related Market Insights & Articles
Explore other comprehensive market analyses, investment ideas, and research reports.